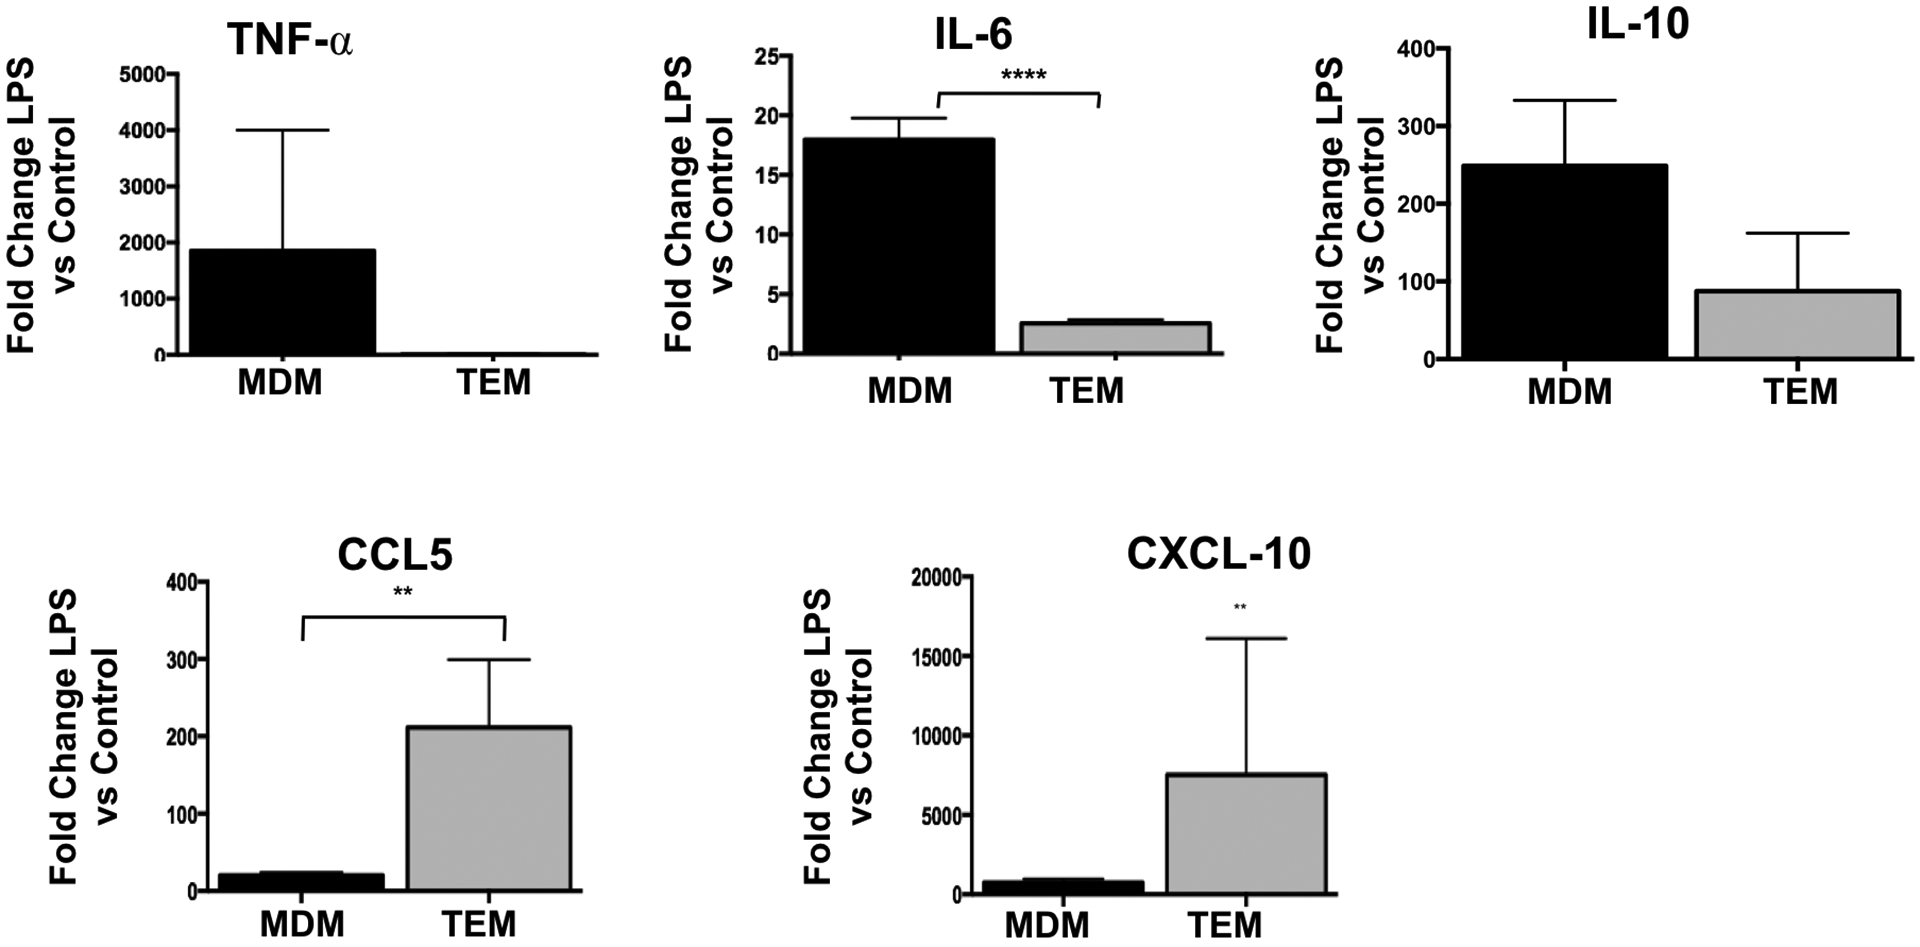
Figure 4. Validation of the differential cytokine profile in response to TLR4 ligation by LPS.

Freshly isolated CD14+ monocytes were differentiated with trophoblast CM (TEM) or M-CSF (MDM) for 6 days. Following differentiation cells were exposed to LPS for 24 hrs and mRNA of each cytokine was quantified by qPCR using specific primers. Data was presented for each cytokine as fold changes in mRNA expression calculated for each group treated with LPS in relation to their respective control (treated with vehicle). Data presented as mean + SD and are shown for 6 independent experiments with each done in triplicate. ** p=0.01; **** p=0.001
