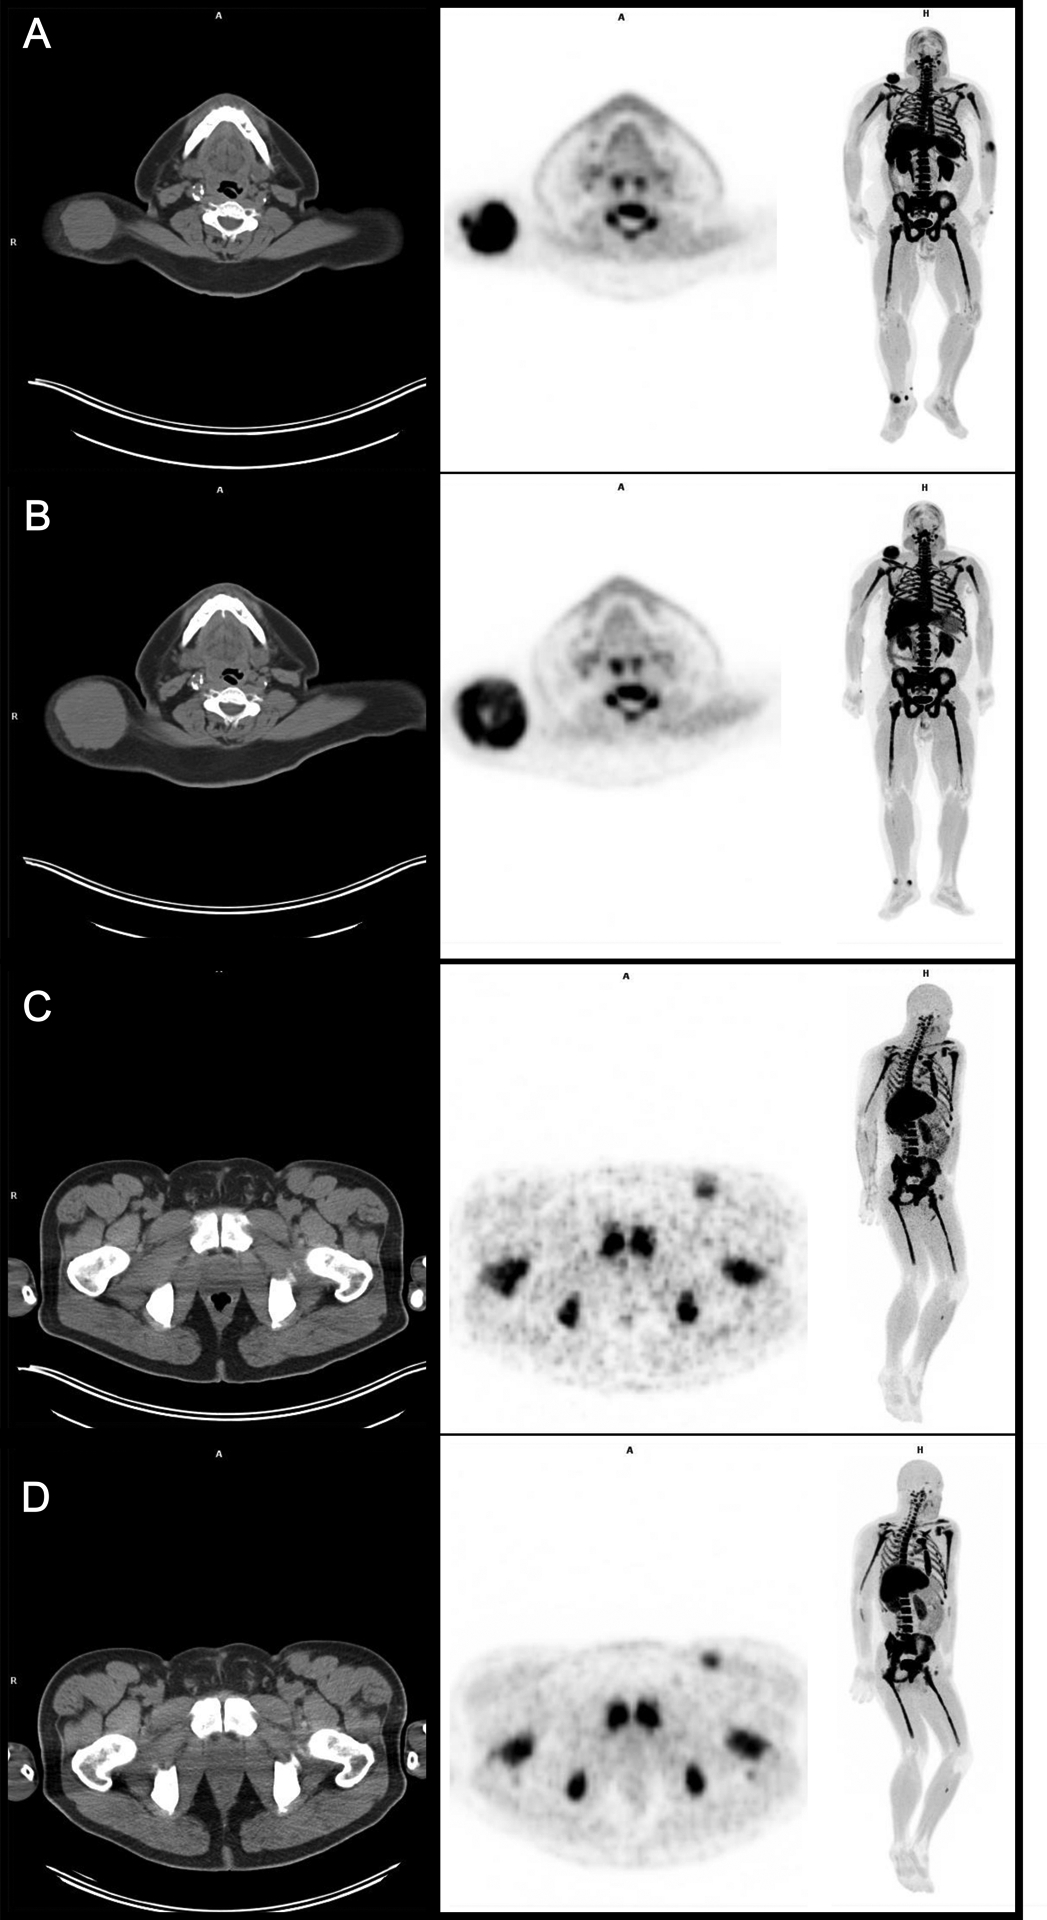
Figure 2:

Left to right images: CT, FLT-PET, and FLT-PET whole body maximum intensity projection (MIP). A and B) A shows the baseline scans and B shows the follow-up scans. Patient 4’s dominant lesion in the right subcutaneous back increased in size on CT during the follow up FLT-PET scan from 52 mm to 72 mm, however the SUV of the lesion decreased by −14.4%. Thus, there was a discordance between CT size and FLT-PET SUV on that scan. Ultimately, the patient had stable disease on follow up CT 12 weeks later which suggests that the FLT was a better and earlier predictor of the ultimate outcome.
C and D) C shows the baseline scans and D shows the follow-up scans. The patient’s left inguinal node did not change on CT during the follow up FLT-PET and remained at 19 mm short axis but FLT SUV decreased 21.9%. Ultimately, the patient had partial response on follow up CT 12 weeks later which again demonstrates the advantage of FLT over CT as an early predictor of response.
