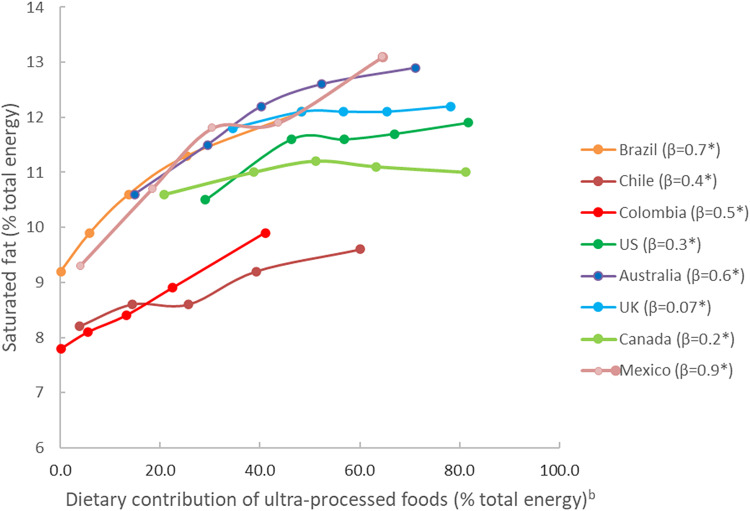
Fig. 1.
Adjusteda mean dietary content of saturated fatty acids across quintiles of the dietary contribution of UPFs in eight countries. aAdjusted according to covariates listed in Table 1. bKnots corresponding to country-specific quintiles of the dietary contribution of UPFs. *Statistically significant coefficient for linear trend (P < 0⋅05).

