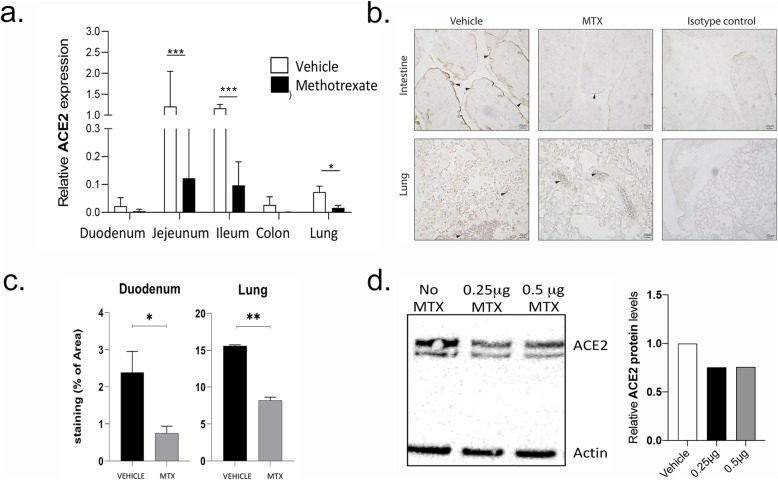
Fig. 2.
MTX down-regulates ACE2 expression. a Real-time PCR showing quantification of mRNA for ACE2 in the various segments off the intestine and the lung in mice treated with methotrexate (MTX; N = 3 per group per experiment; data summarized from two independent experiments). b Representative immune histochemistry staining for ACE2 (brown color, arrowheads) in the intestine and the lung of mice treated with methotrexate or vehicle for 3 days. Isotype control antibody staining is also shown. c Quantification of ACE2 expression in immune histochemistry (N = 3 per group per experiment; data summarized from two independent experiments). d Representative immunoblot for ACE2 and actin (control) in intestinal organoids treated with two doses of methotrexate including densitometric quantification

