. 2021 May 24;6(22):14004–14014. doi: 10.1021/acsomega.0c05987
© 2021 The Authors. Published by American
Chemical Society
Permits non-commercial access and re-use, provided that author attribution and integrity are maintained; but does not permit creation of adaptations or other derivative works (https://creativecommons.org/licenses/by-nc-nd/4.0/).
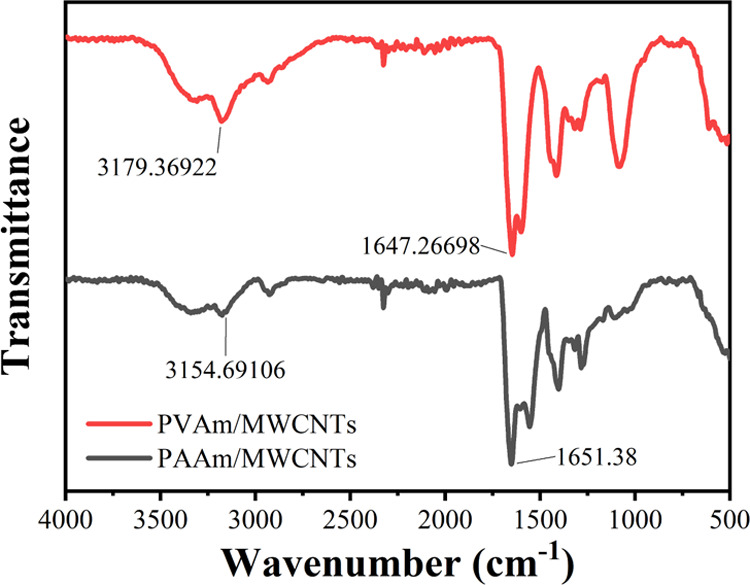
Figure 8.

FT-IR graph of PAAm/MWCNTs and PVAm/MWCNTs.
