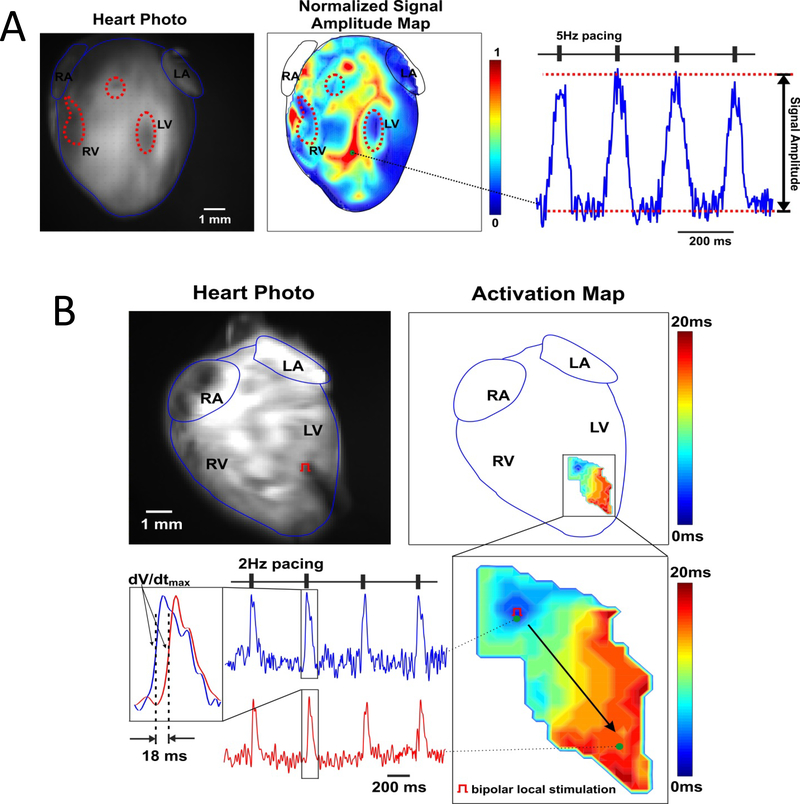
Fig. 4. iCPC-derived cardiomyocytes mature in heart scaffold and show Ca2+ transients and cell-cell coupling.
High resolution fluorescent optical mapping of Ca2+ transients (CaTs) from recellularized cardiac scaffolds during field (A) and point (B) stimulation. (A) Fluorescent photo of Ca2+-sensitive dye Rhod-2-stained recellularized mouse heart (right panel). Highlighted by dotted red lines areas indicate regions of low fluorescence, presumably, due to a low cell density; these areas corresponded with areas with no CaT signals (dark blue) in normalized optical single amplitude distribution map, whereas other areas showed prominent Ca2+ signals during 5Hz field pacing stimulation as indicated by dark red color (middle panel – calcium activity correlated with GFP signal intensity during live imaging – Figure 4A, 4 wk scaffold). Such areas suggested live and functioning cardiomyocyte clusters with appropriate Ca2+ cycling distributed within the recellularized heart scaffold. On the right panel, a representative CaT recording from such clusters is shown. RA and LA – right and left atria, RV and LV – right and left ventricles. (B) Top panels: fluorescent photo of stained recellularized mouse heart (left) with pacing electrode positioned in the middle of the LV (red pacing symbol), and corresponding CaT activation map reconstructed during constant (2 Hz) pacing. Near the activation map, a color time scale shows CaT activation time. Below, an enlarged area of continuous propagation of CaT throughout the LV induced by point stimulation is shown together with representative CaT recordings collected from the beginning and the end of activated area. Activation time was calculated as a time at (dF/dt)max and used to calculate conduction velocity. Bipolar local stimulation revealed that the calcium signal propagated between the two sites shown, indicating cardiomyocyte cell-cell coupling within the scaffold.

