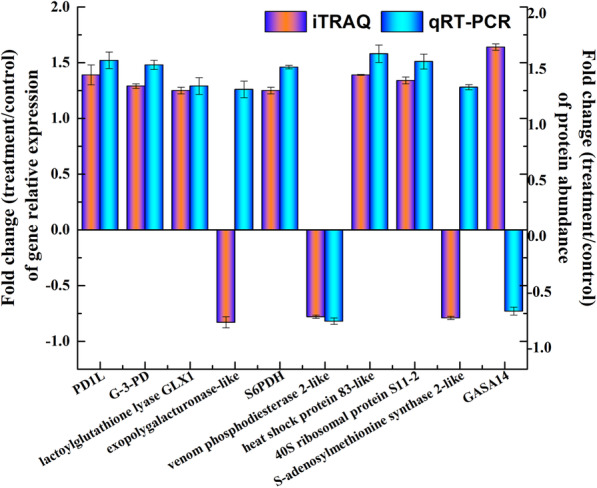
Fig. 6.

Correlation of mRNA level and protein abundance by iTRAQ. The fold-change of treatment/control at the transcript level using the RT-qPCR approach of 10 candidate genes involved in the identified differentially expressed proteins and the protein expression level by iTRAQ is shown in the figure. A positive number indicates upregulation, and a negative number indicates downregulation. Each histogram represents the mean value of three biological replicates, and the vertical bars indicate the standard error (n = 3). Definition of 10 candidate genes involved in the identified differentially expressed proteins: (1) PD1L, pyruvate decarboxylase 1 like; (2) G-3-PD, glyceraldehyde-3-phosphate dehydrogenase; (3) S6PDH, sorbitol-6-phosphate dehydrogenase; (4) GASA14, Gibberellin-regulated protein 14
