Fig. 2.
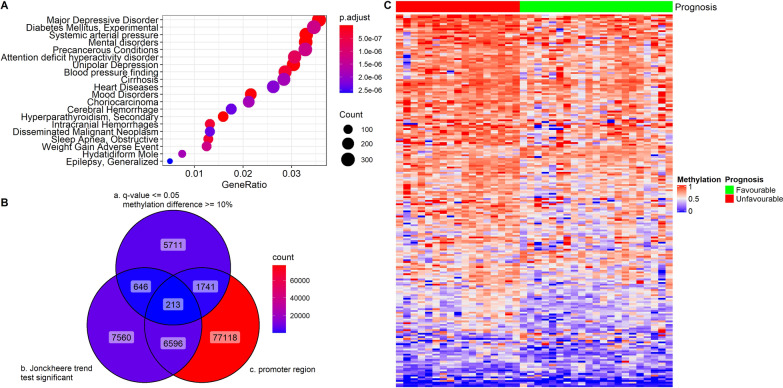
DMR analysis of Stage II CRC prognosis. A Dotplot of enriched terms using DMRs among Stage II favorable prognosis and Stage II unfavorable prognosis tumor samples. A total of 19,809 genes which had DMR in the promoter regions were used for the enrichment analysis of disease-gene associations. B Venn diagram for selecting the final 213 prognostic DMR markers. a) 8,311 candidate DMRs between Stage II favorable and unfavorable prognosis samples (q value ≤ 0.05 & methylation differences ≥ 10%); b); 15,015 DMRs shown statistic significances (p value ≤ 0.05) in Jonckheere trend test among 59 CRC tumor and 11 tumor -adjacent samples; c) 85,668 DMRs overlapping with a gene promoter region (1500 bp upstream/500 downstream of transcription start site); C Heatmap of the final 213 prognosis marker methylation values in 21 Stage II favorable and 17 unfavorable prognosis tumor samples

