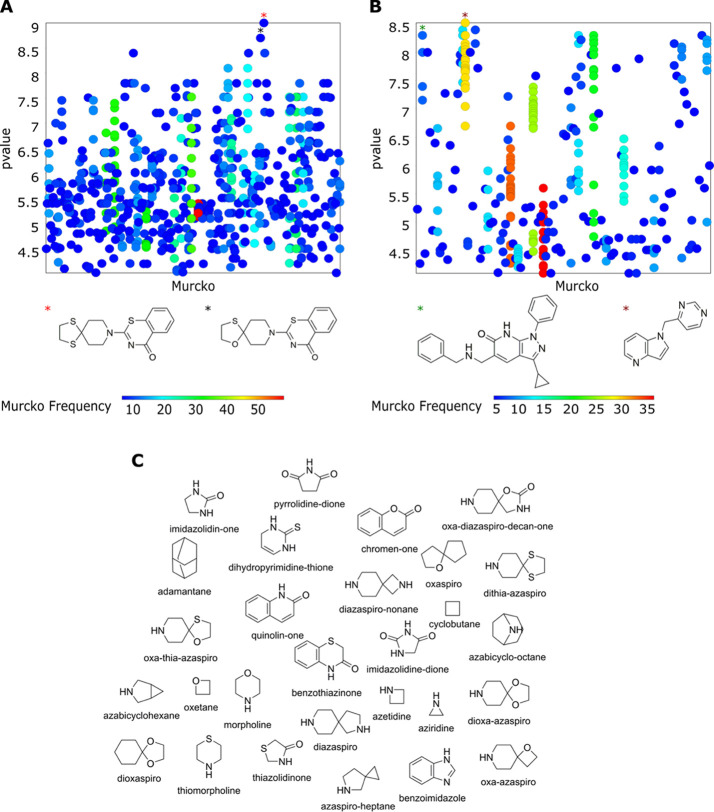
Figure 2.
Murcko scaffold structures vs p value scatter plot. (A) MIC value dataset. (B) IC50 value dataset. The frequency of Murcko scaffolds is color-coded, with red representing the highest frequency and blue the lowest frequency. The corresponding scaffolds with the highest frequency are marked by asterisks. (C) Representative examples of three-dimensional parent fragments generated using ECFP6 fingerprint.

