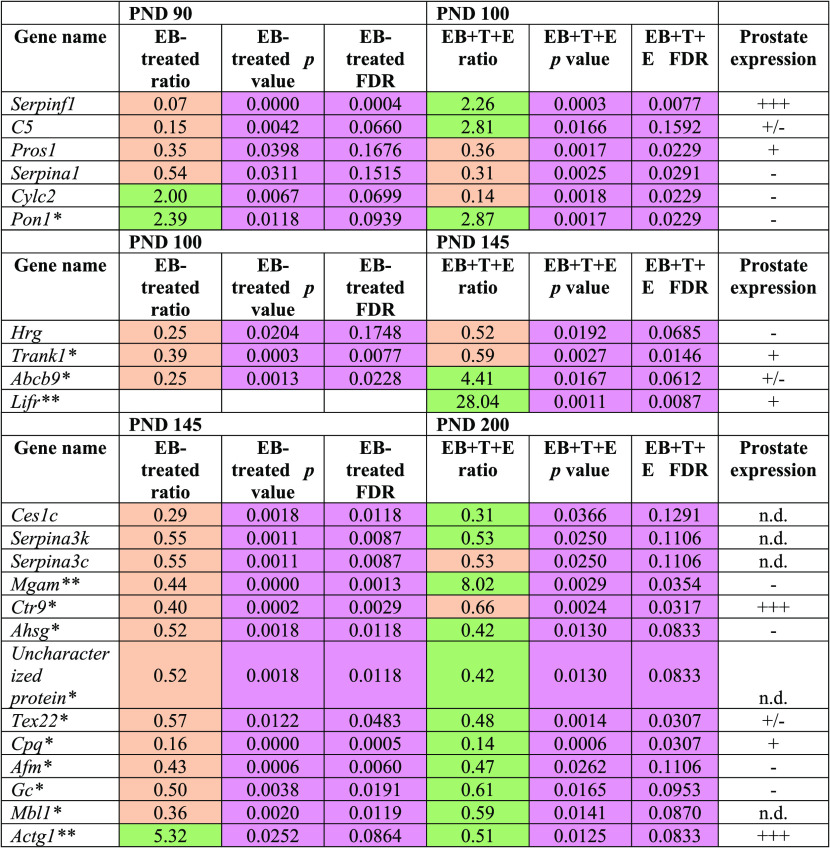
Table 3. Significantly Altered Plasma Protein Levels in the EB+T+E Group on Multiple Collection Points (Fold Change ≥ 1.5, p < 0.05, and FDR < 0.2)a,b.
*Significant differences in the EB and EB+T+E groups on PND 100, PND 145, and PND 200.
**Significant differences only in the EB group on PND 145. Significant differences only in the EB and EB+T+E groups on PND 200. n.d.: no data; prostate expression (www.ncbi.nlm.nih.gov/gene) was categorized into four groups: −, no expression; +/–, faint; + weak; ++ moderate; +++, strong. Coral color indicates down-regulated; green color indicates up-regulated. Pink color shows statistical significances.

