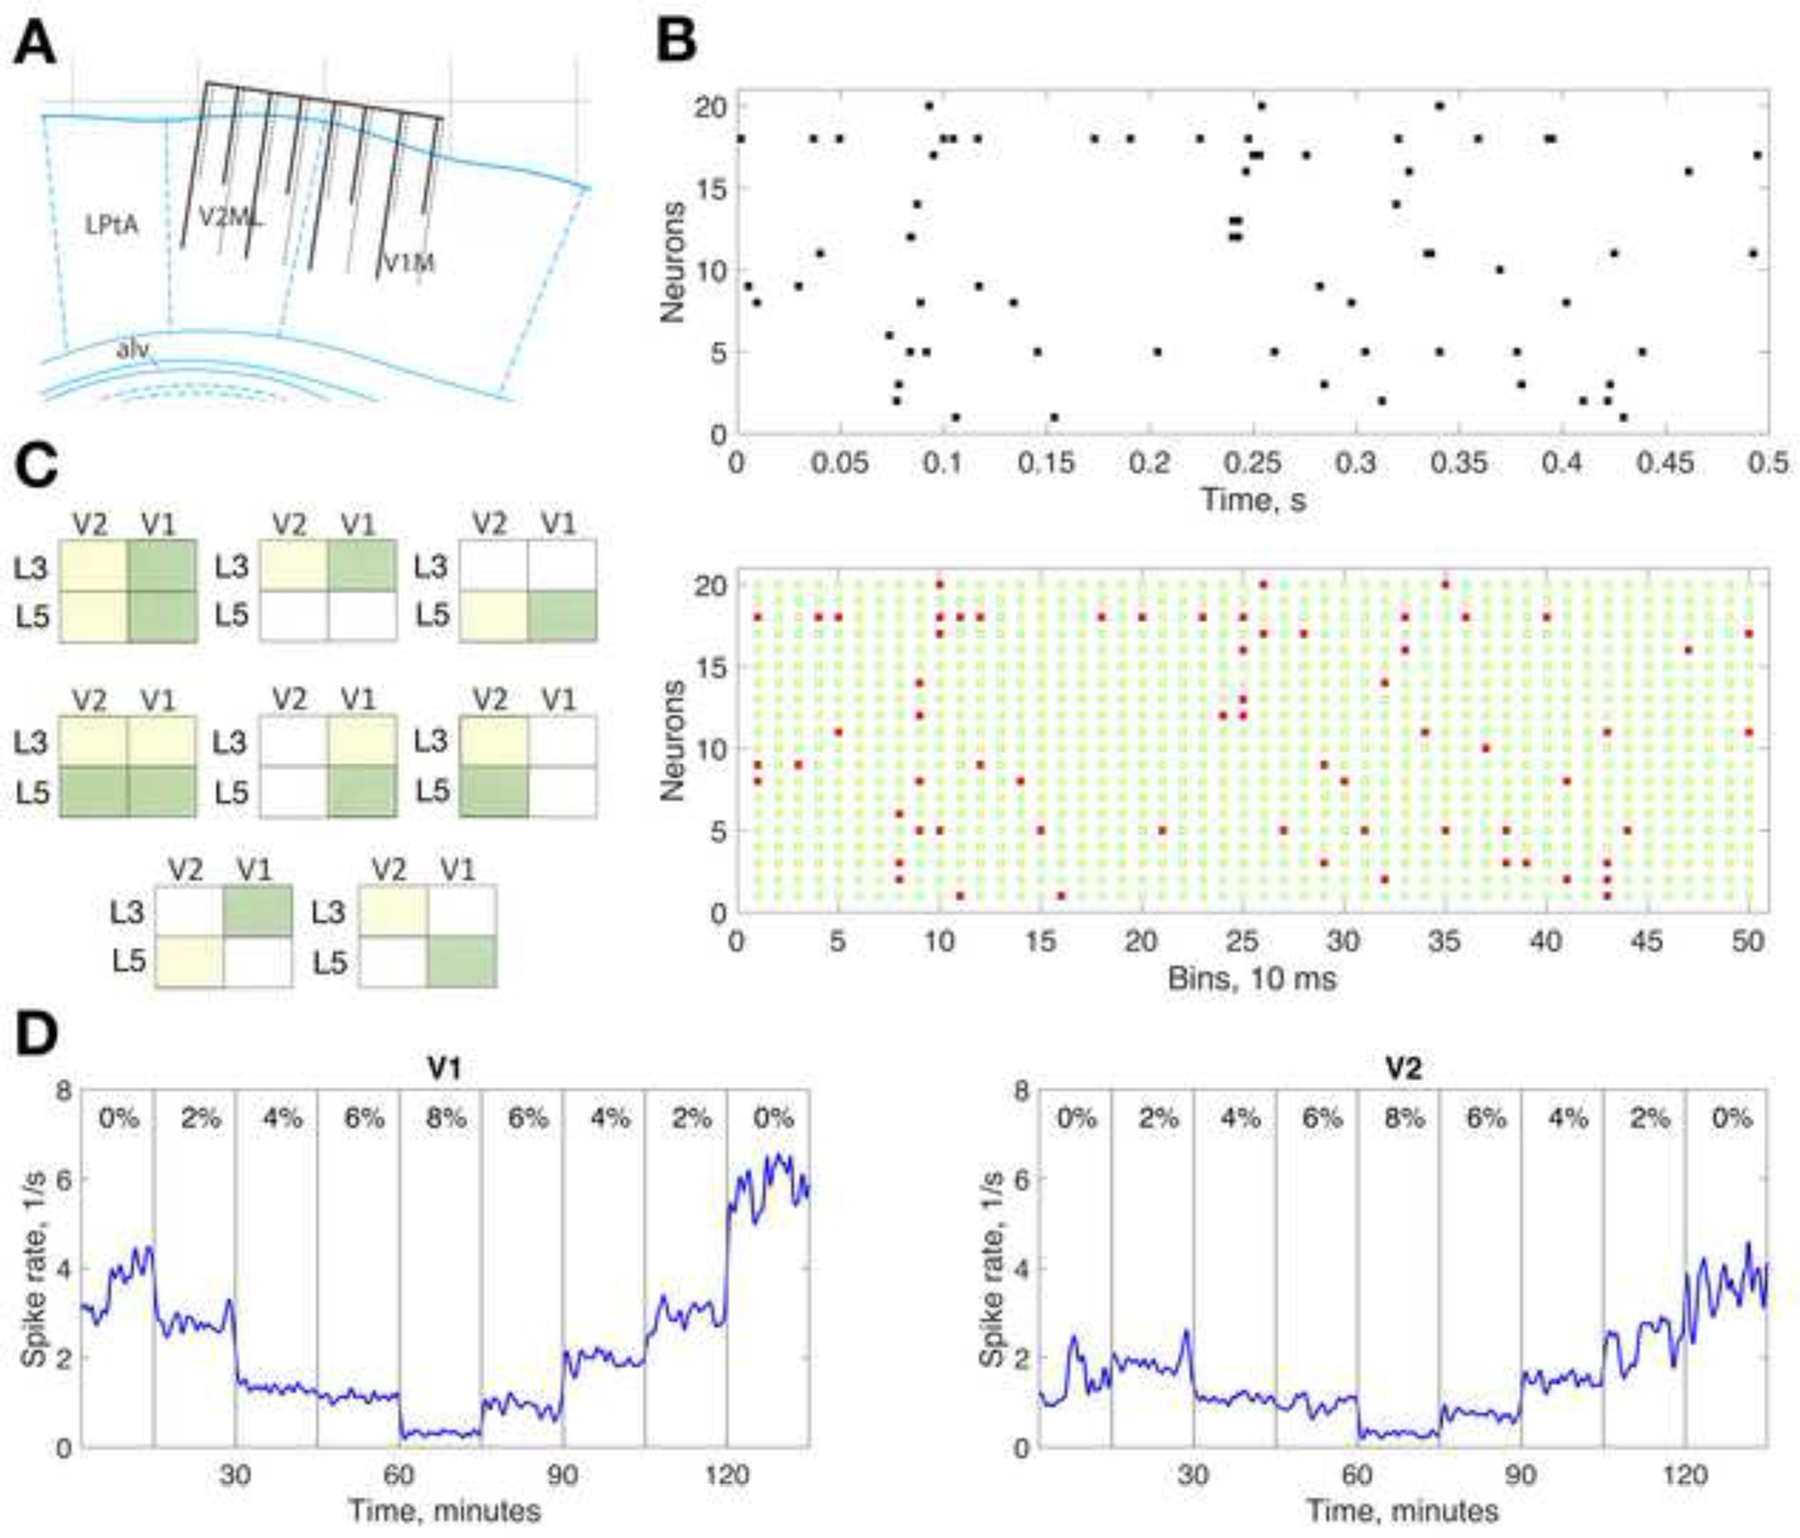
Figure 1.

Microwire array and data analysis. (A) Location of the microwire array in rat visual cortex. Eight wires target primary visual cortex monocular area (V1M) and 8 wires target secondary visual cortex mediolateral area (V2ML). The wires have alternating lengths with wire tips residing approximately in cortical layer 3 and layer 5. Only two rows of wires are illustrated; the second row is shown with dotted lines. Scale above is the distance in mm from Bregma at 3.4 mm lateral position. LPtA: lateral parietal association area. Drawing is based on Paxinos and Watson atlas43. (B) Spike raster plot for 20 recorded neurons in one experiments (top) and binned binary representation of spiking (bottom). Red dots indicate at least one spike present in each 10ms bin, green open circles indicate no spike. Each configuration of coincident red dots across neurons represents a population activity pattern. (C) Pairwise cortical regions (yellow and green areas) for which mutual information and transfer entropy were calculated. (D) Time course of average spike rate from all units within V1 and V2 in one experiment. Spike rate was calculated for 10-second time bins and 10-point Gaussian smoothing was applied. Data from consecutive anesthetic states were concatenated, thus the time axis shows cumulative recording time, not real time. Vertical gray lines demarcate anesthetic conditions with percent inhaled concentration of desflurane indicated.
