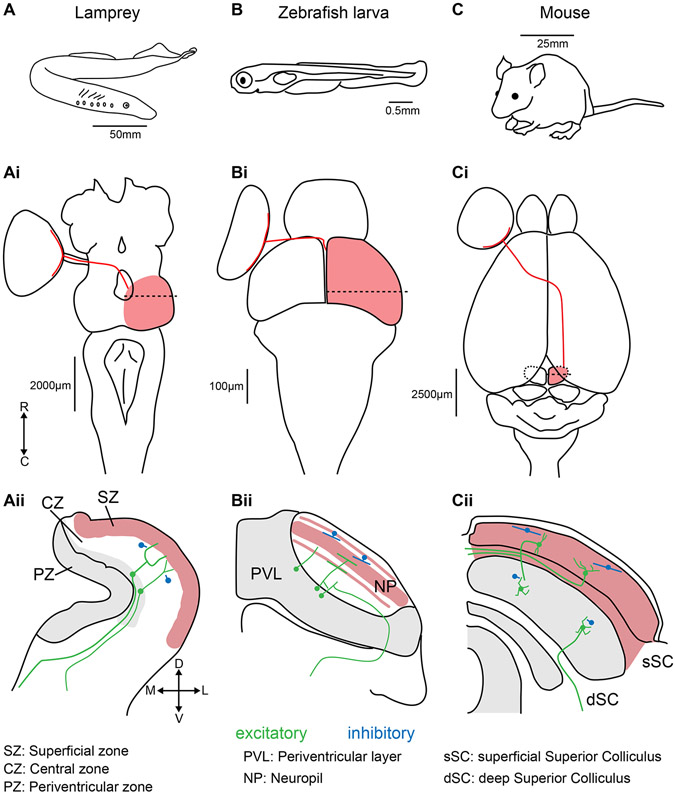
Figure 1: Positions, sizes, and retinal inputs to the tectum/SC in lampreys, zebrafish larvae, and mice.
(A) The lamprey (Lampetra fluviatilis). (Ai) Dorsal view of a lamprey brain. Retinal ganglion cell projections (red line) from the left eye cross the optic chiasm to enter the right tectum (red shading). The dashed line represents the position of the coronal section displayed in (Aii). Major divisions are based on Butler and Hodos, 2005 19. The red shaded region represents the layers that receive retinal input. The grey shaded area represents regions with a high density of neuronal somae. Local inhibitory interneurons are represented in blue. Ipsilateral and contralateral glutamatergic projecting neurons are represented in green. The same features are shown for larval zebrafish (B-Bii) and mouse (C-Cii). R: rostral, C: caudal, D: dorsal, V: ventral, M: medial, L: lateral.

