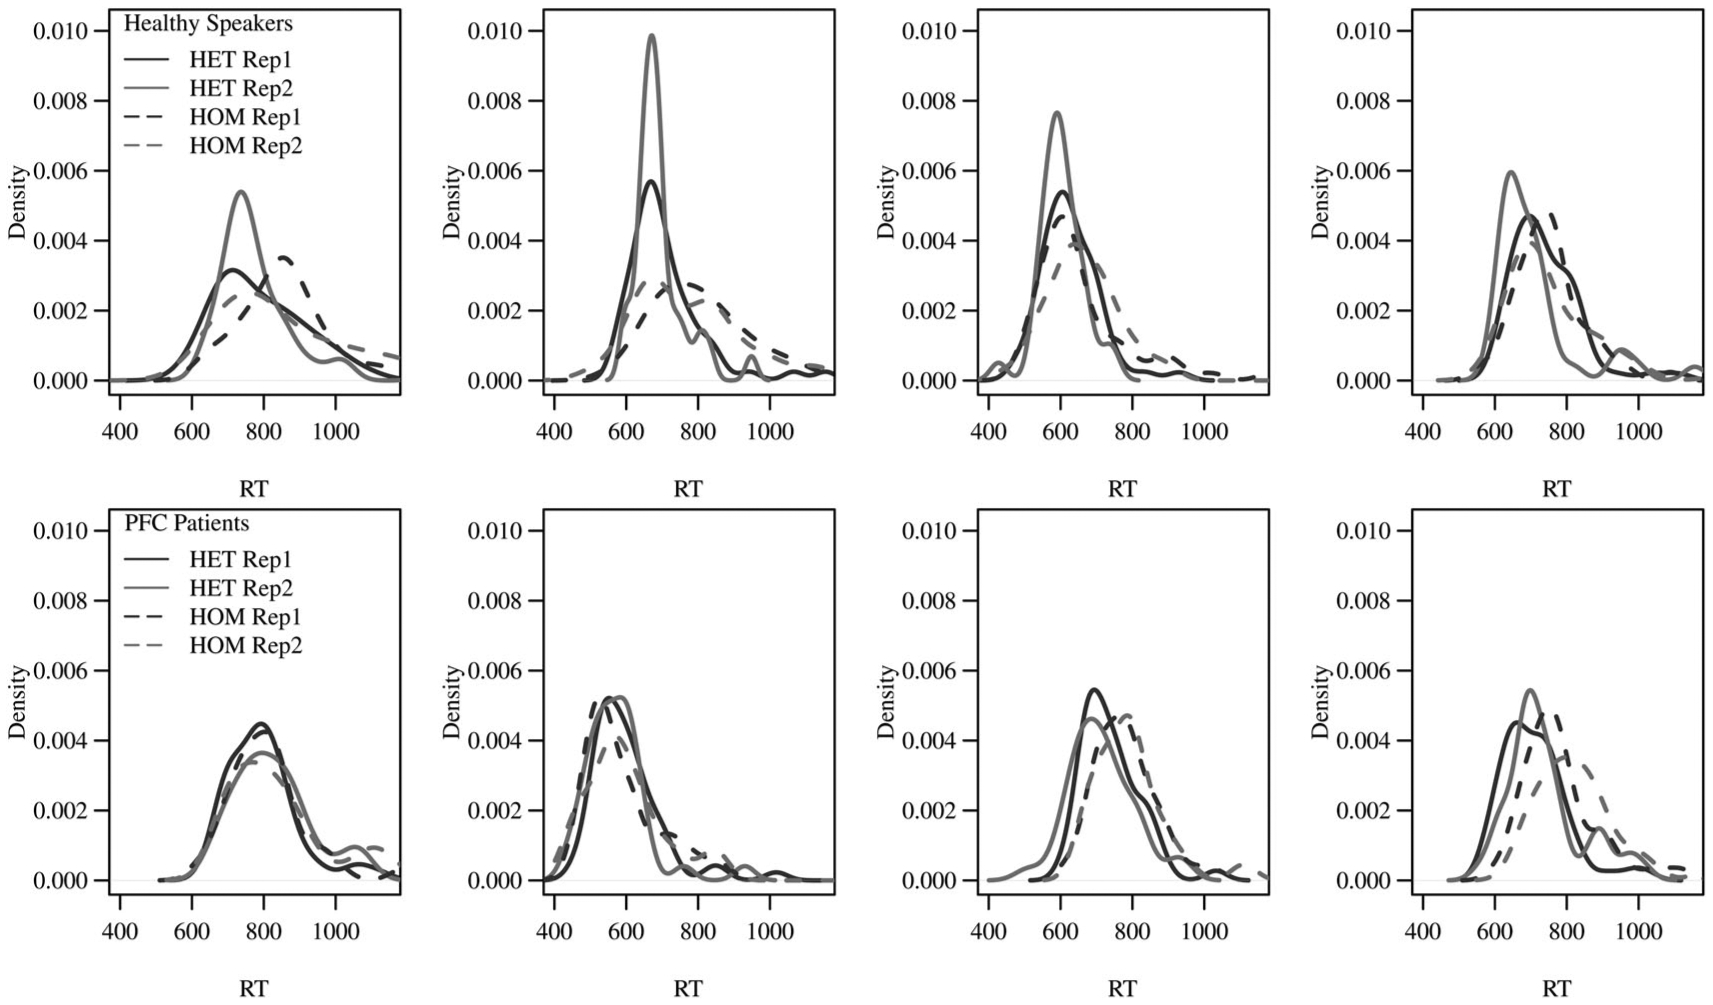
Figure 3.

An illustration of the experimental cell distributions by subject that the SWM fits. The four distributions in each subject’s plot respectively correspond to the HET/HOM conditions at repetition levels 1 (cycles 2–3) and 2 (cycles 4–6) for one lag level (>5).
