
Figure 4.
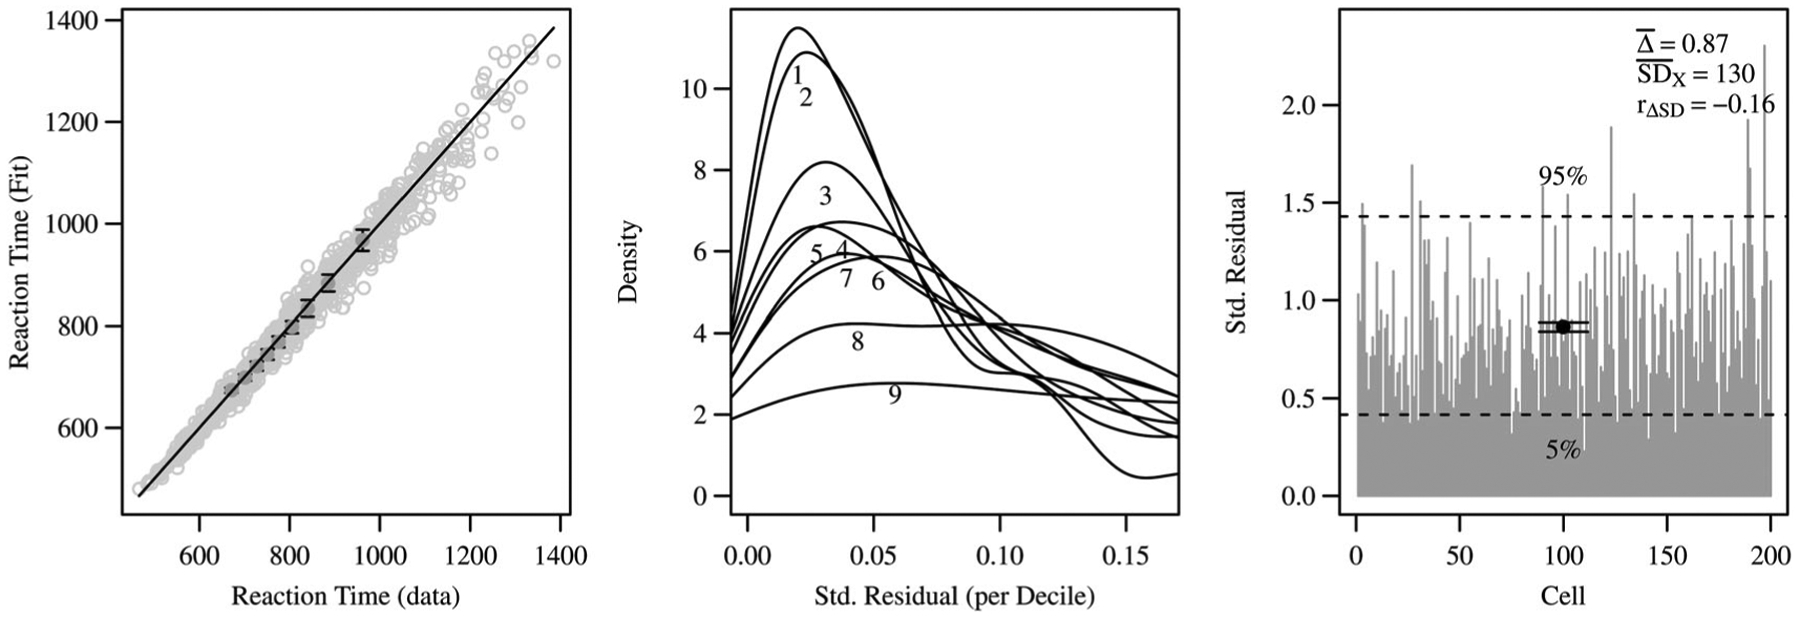
Diagnostics for the SWM fit to the observed data. The left plot shows the QQ match for the nine deciles (0.1 to 0.9) for each of the 200 cells. The middle plot shows the distribution of residuals for each these nine deciles across the 200 cells, where the residual is the absolute difference (in ms) between the observed decile and the model-predicted decile, and here the residuals are standardized (divided) by the corresponding cell’s model-estimated standard deviation. The right plot provides the sum of these standardized residuals of the nine deciles (by cell); including statistics respectively for the mean cell residual , the mean cell standard deviation , and the correlation between the two across cells.