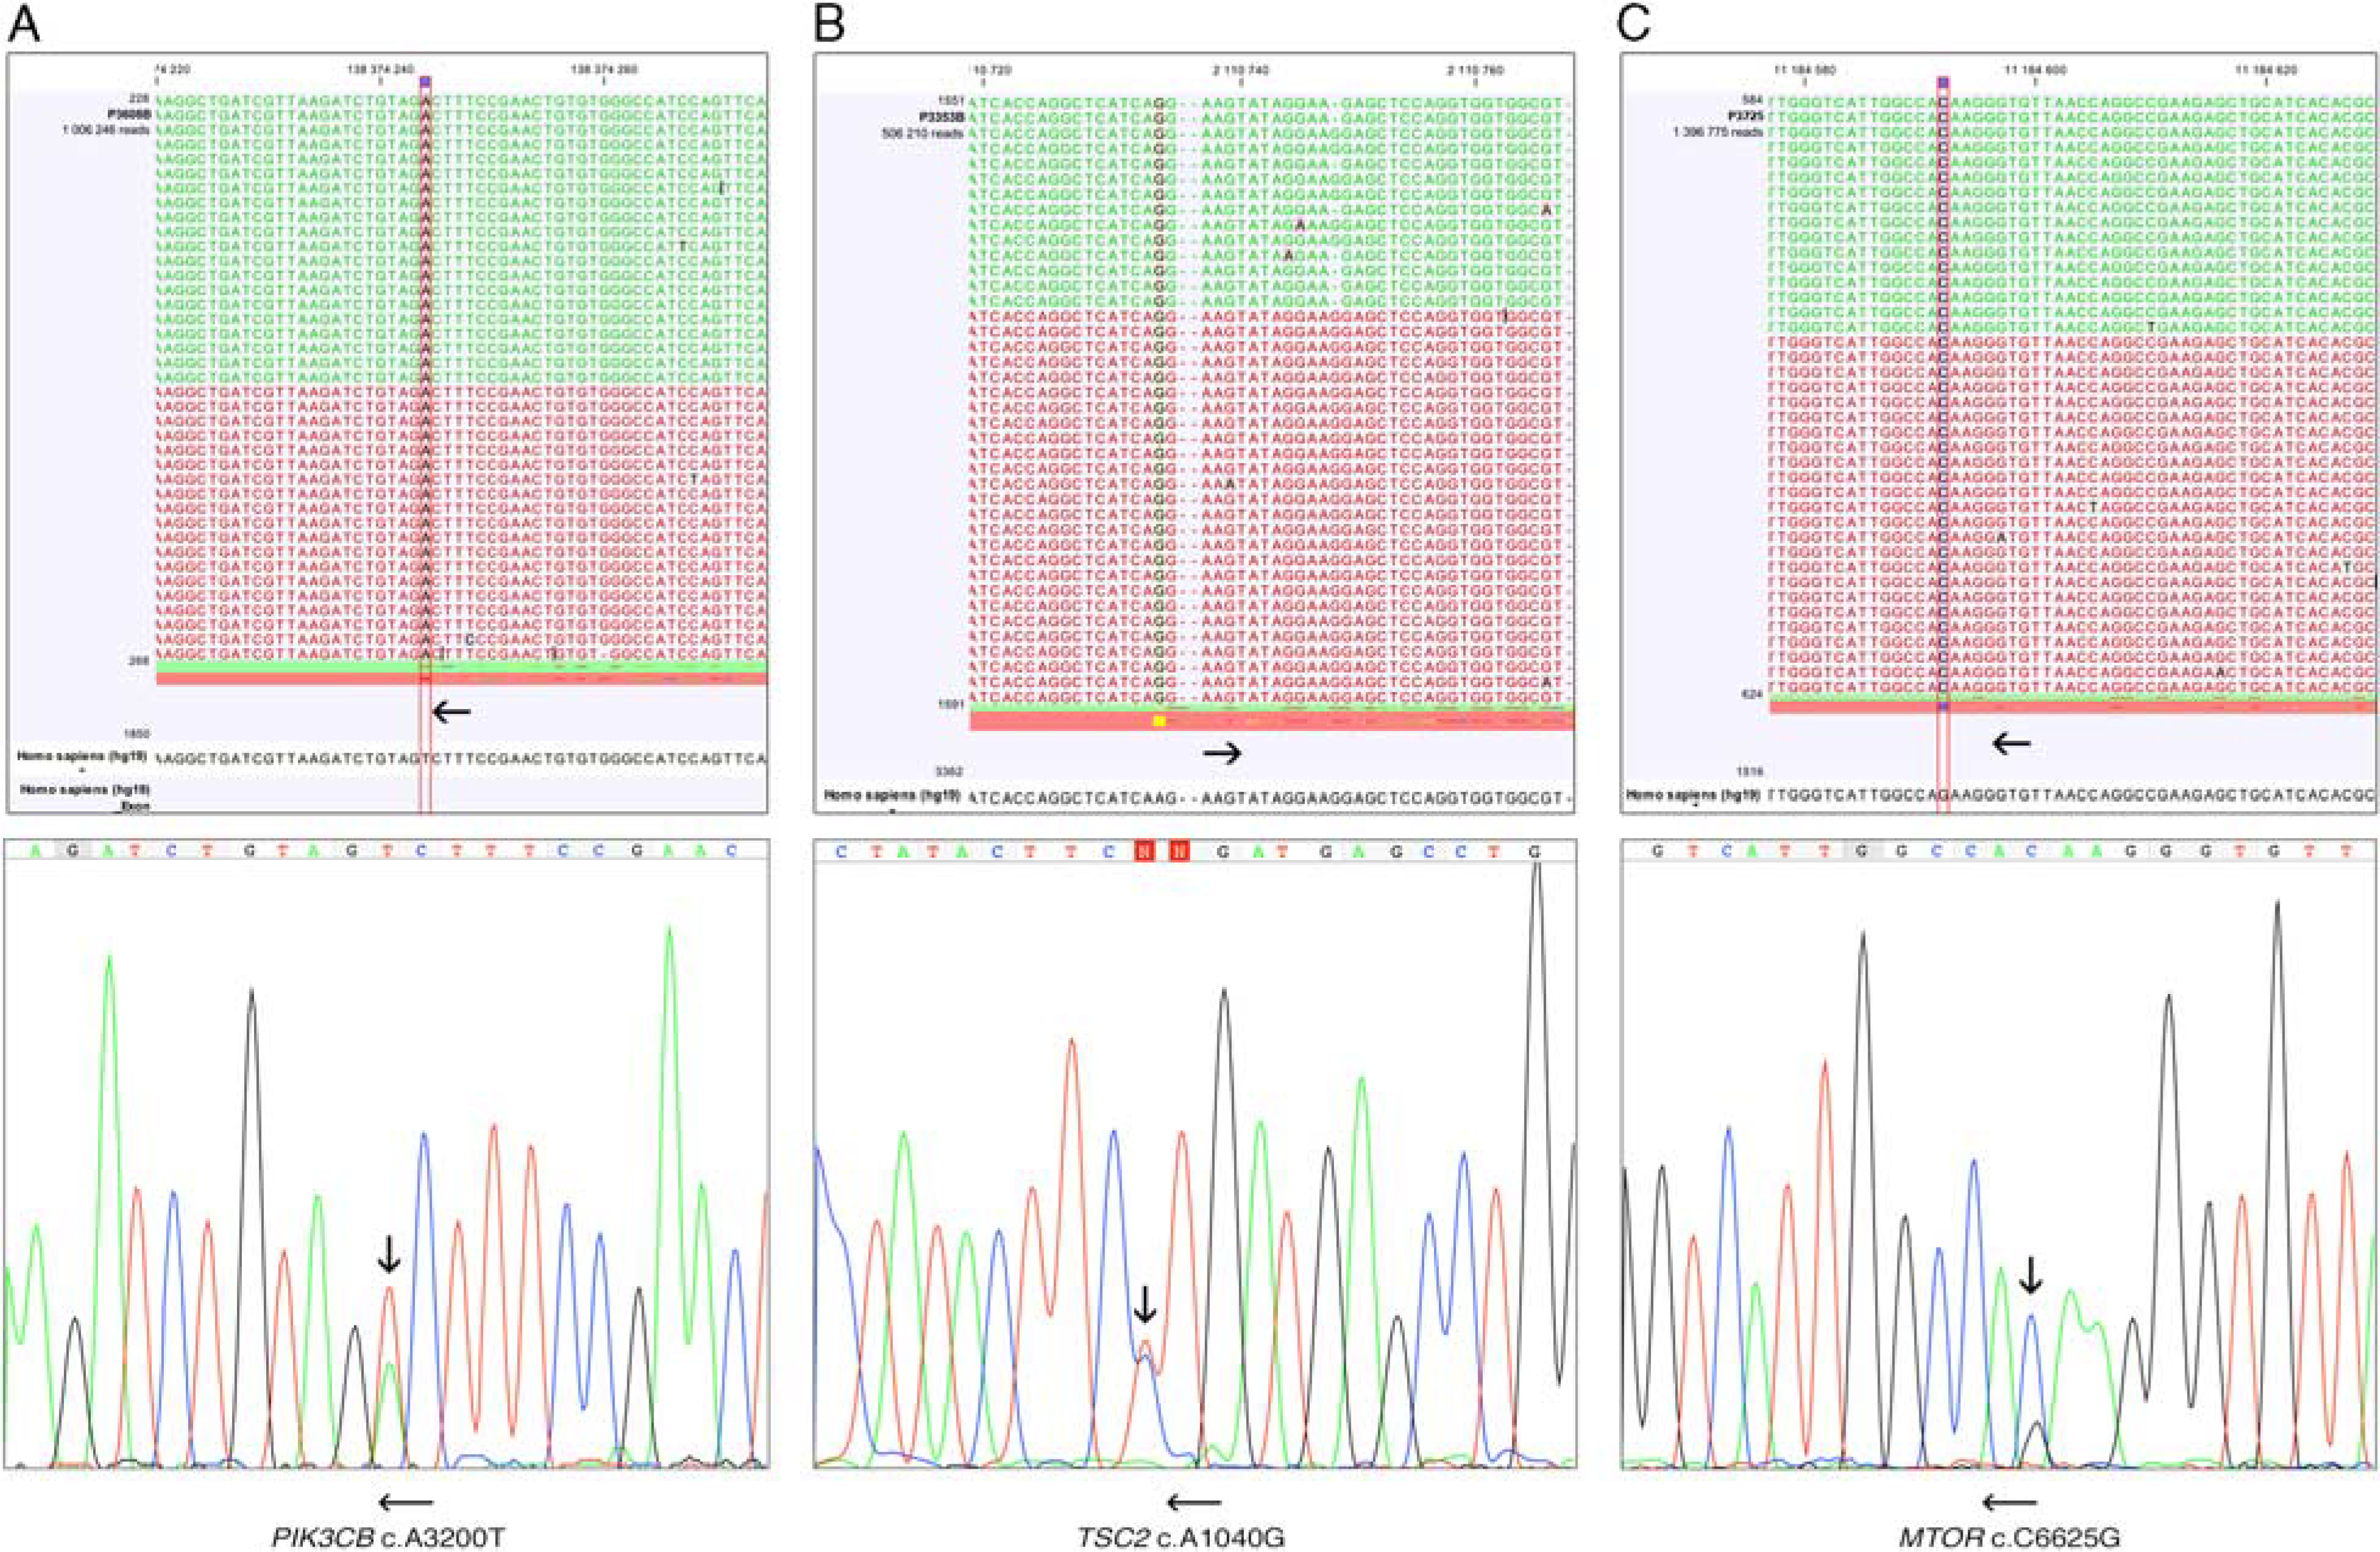
FIGURE 1.

Screen shots of the next-generation sequencing data analysis and Sanger sequencing chromatograms. PIK3CB c.3200A > T mutation (A) TSC2 c.1040A > G mutation (B), mTOR c.6625C > G mutation (C). Vertical arrows indicate substitutions. Horizontal arrows indicate forward and reverse orientations.
