
Fig. 2.
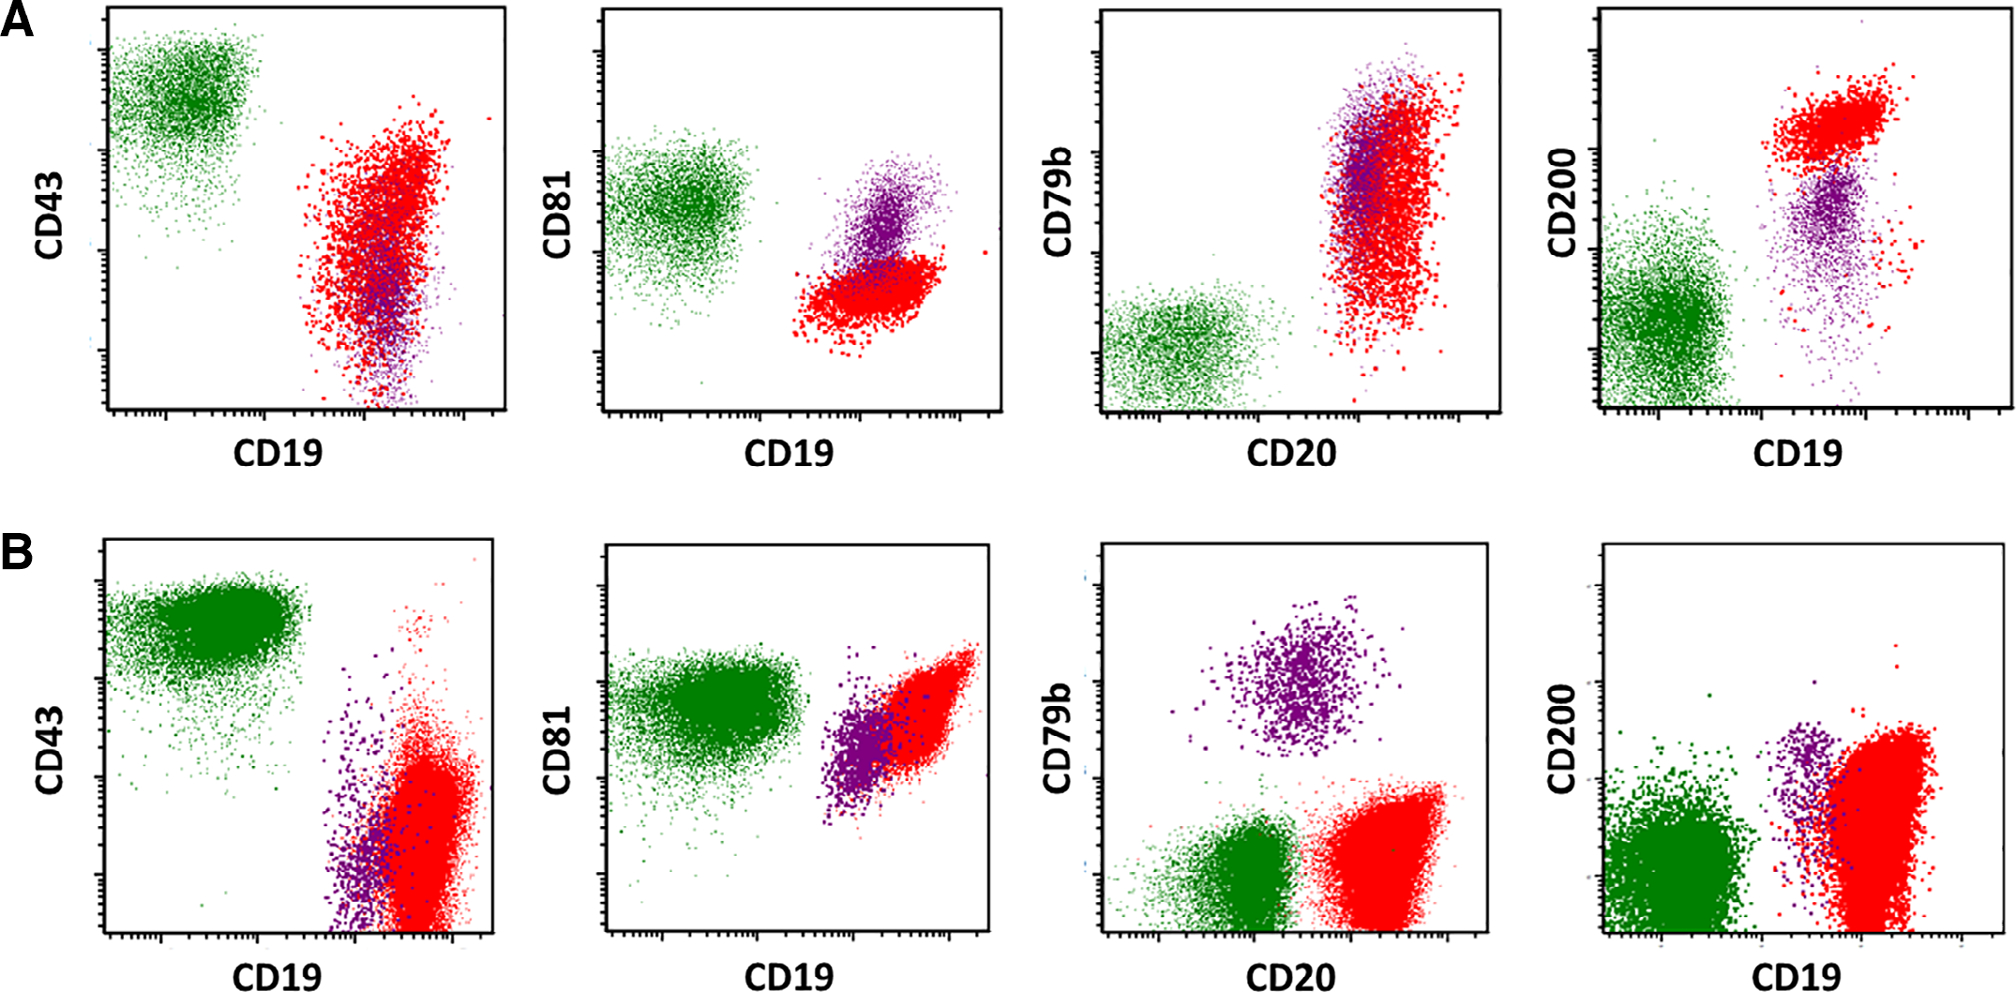
Expression patterns of CD43, CD81, CD79b, and CD200 in a representative case of HCL (A, top row) and HCLv (B, bottom row). Cell populations are designated as follows: T-cells (green), normal B-cells (purple), and HCL or HCLv cells (red).
Official websites use .gov
A
.gov website belongs to an official
government organization in the United States.
Secure .gov websites use HTTPS
A lock (
) or https:// means you've safely
connected to the .gov website. Share sensitive
information only on official, secure websites.
Expression patterns of CD43, CD81, CD79b, and CD200 in a representative case of HCL (A, top row) and HCLv (B, bottom row). Cell populations are designated as follows: T-cells (green), normal B-cells (purple), and HCL or HCLv cells (red).