
FIGURE 2.
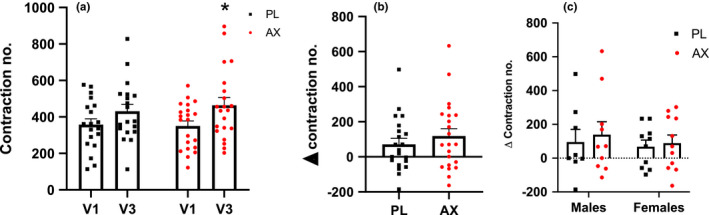
TA muscle endurance represented as the number of contractions from ankle dorsiflexion. (a): Number of contractions before (V1) and after training and supplementation (V3) (*p < 0.05, V3 compared to V1) (b): Difference in number of contractions between V3 and V1 by group. (c): Difference in number of contractions between V3 and V1 by sex. Data presented as mean ± S.E