
FIGURE 5.
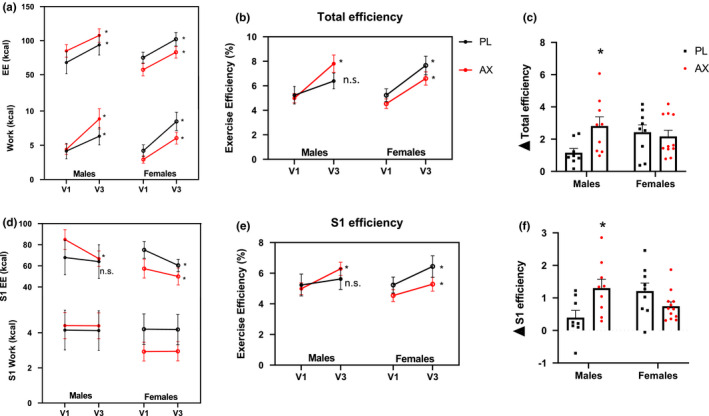
Exercise efficiency. (a): Total work and energy expenditure from GXT test. (b): Total exercise efficiency (work/ energy expenditure) (c): Difference in total efficiency between V3 and V1. (d): S1 stage work and energy expenditure from GXT test. (e): S1 efficiency between sexes. (f): Difference in S1 efficiency between V3 and V1. Data presented as mean ± S.E. (A,B,D,E *p < 0.05, V3 compared to V1; C, F *p < 0.05 AX compared to sex‐matched PL)