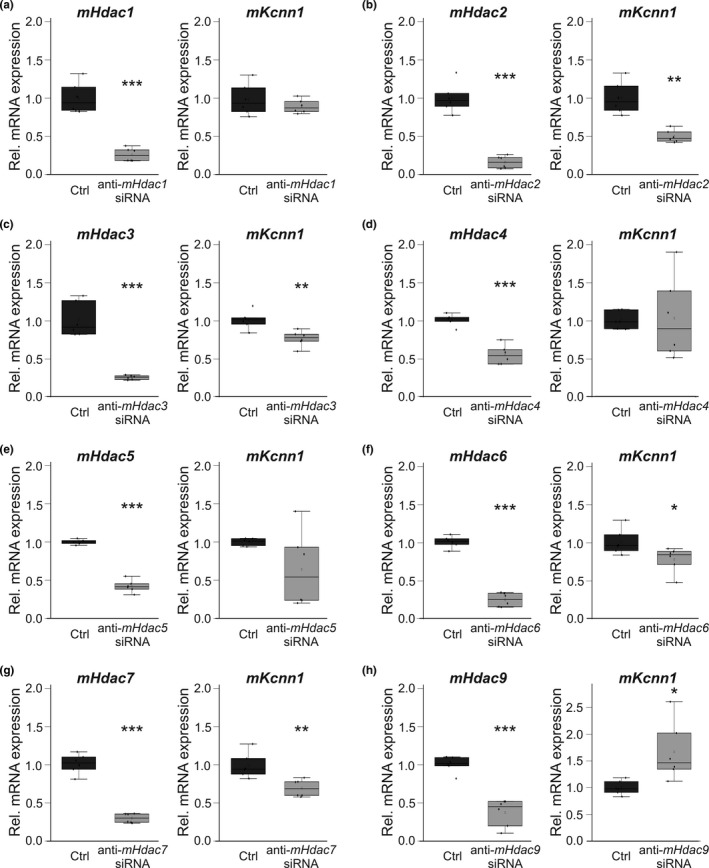
FIGURE 7.

Hdac‐related remodeling of Kcnn1 mRNA in HL‐1 atrial myocytes. (a–h) Left panels, transcript abundance of indicated Hdacs was calculated following application of respective anti‐Hdac siRNAs (n = 6 each) in relation to control cell cultures (Ctrl; n = 6 each). (a‐h) Right panels, relative Kcnn1 (n = 6 each) mRNA levels were measured after genetic knockdown of indicated Hdacs and compared with respective controls in the absence of siRNA (n = 6 each). Please note that data on Hdac2 suppression by anti‐Hdac2 siRNA have been published previously (Rahm et al., 2021). Data are given as box plots with dots representing individual data. *p < 0.05, **p < 0.01, ***p < 0.001 versus control cells
