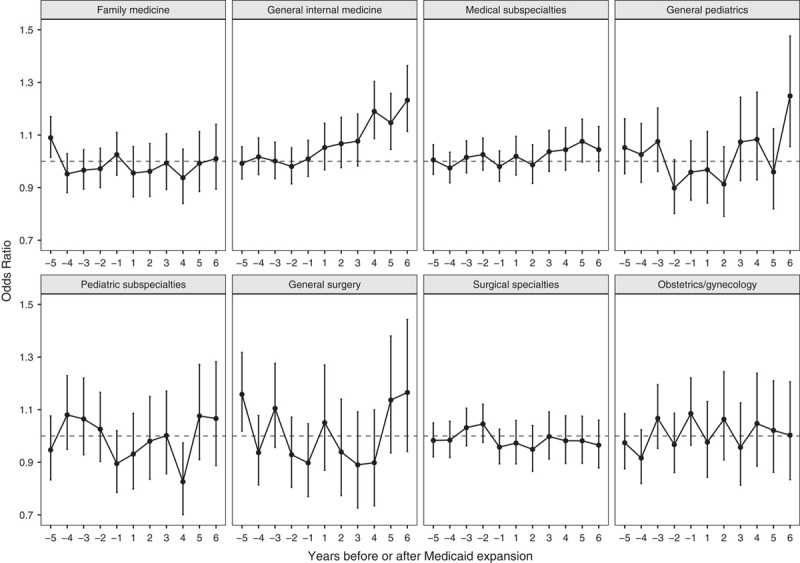
FIGURE 1.

Odds of new physicians locating in a Medicaid expansion state in each preexpansion and postexpansion year relative to the average odds of locating in those states over 5 preexpansion years, by specialty group. Years −5 to −1 indicate preexpansion years and years 1–6 indicate postexpansion years. The graph shows the point estimate and 95% confidence interval for the odds ratio in each year. An odds ratio=1.0 in a particular year means that physicians were equally likely to locate in an expansion state in that year than they were, on average, during the preexpansion period. An odds ratio >1.0 in a particular year means that physicians were more likely to locate in an expansion state in that year than they were, on average, during the preexpansion period.
