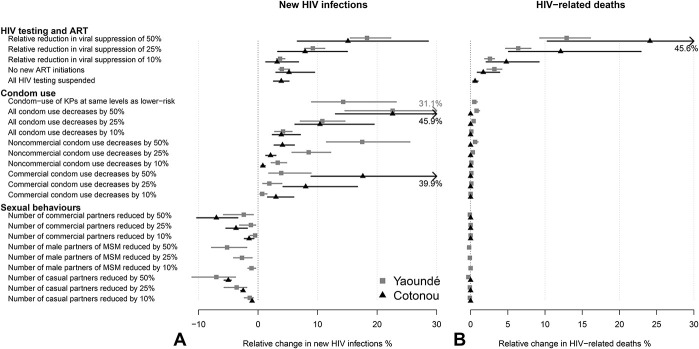
FIGURE 1.
First set of scenarios: relative change in the cumulative number of HIV infections (A) and HIV-related deaths (B) over 1 year under individual scenarios assuming 6-month disruptions, compared with base–case in Yaoundé (gray) and Cotonou (black). Dots represent median estimates across model predictions, whereas lines represent 95% UI (2.5th and 97.5th percentile of the estimates). UI, uncertainty interval.

