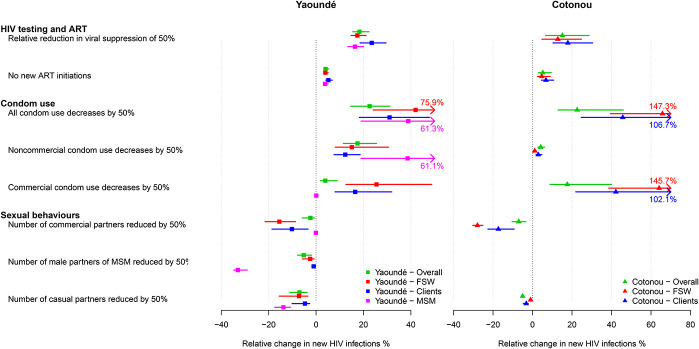
FIGURE 2.
Impact of disruptions among risk groups: relative change in the cumulative number of new HIV infections in Yaoundé (squares) and Cotonou (triangles) over 1 year under individual scenarios assuming 6-months disruptions, calculated overall (green dots and lines), among MSM (pink dots and lines), FSW (red dots and lines), and their clients (blue dots and lines). Dots represent median point estimates across model predictions, whereas lines represent 95% UI (2.5th and 97.5th percentile of the estimates).

