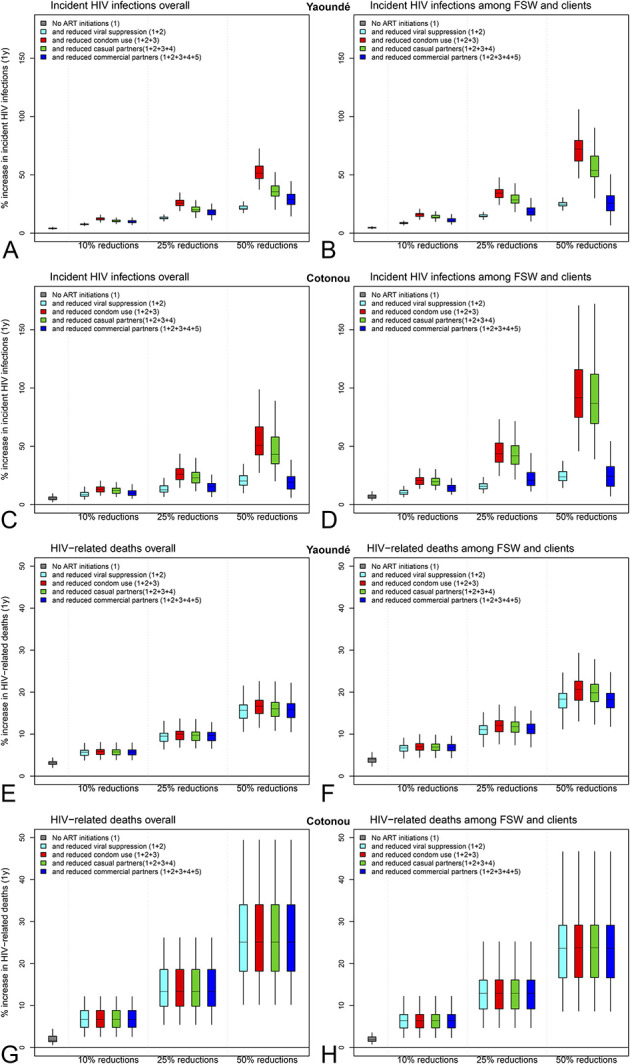
FIGURE 3.

Impact of combined disruption scenarios: relative change in the cumulative number of new HIV infections among (A) overall population and (B) FSW and their clients in Yaoundé, (E) overall population and (F) FSW and their clients in Cotonou, and HIV-related deaths over 1 year among (C) overall population and (D) FSW and their clients in Yaoundé, (G) overall population and (H) FSW and their clients in Cotonou under additive combined scenarios assuming no ART initiations and 10/25/50% reductions. Boxplots represent median, interquartile range and 95% UI across model predictions.
