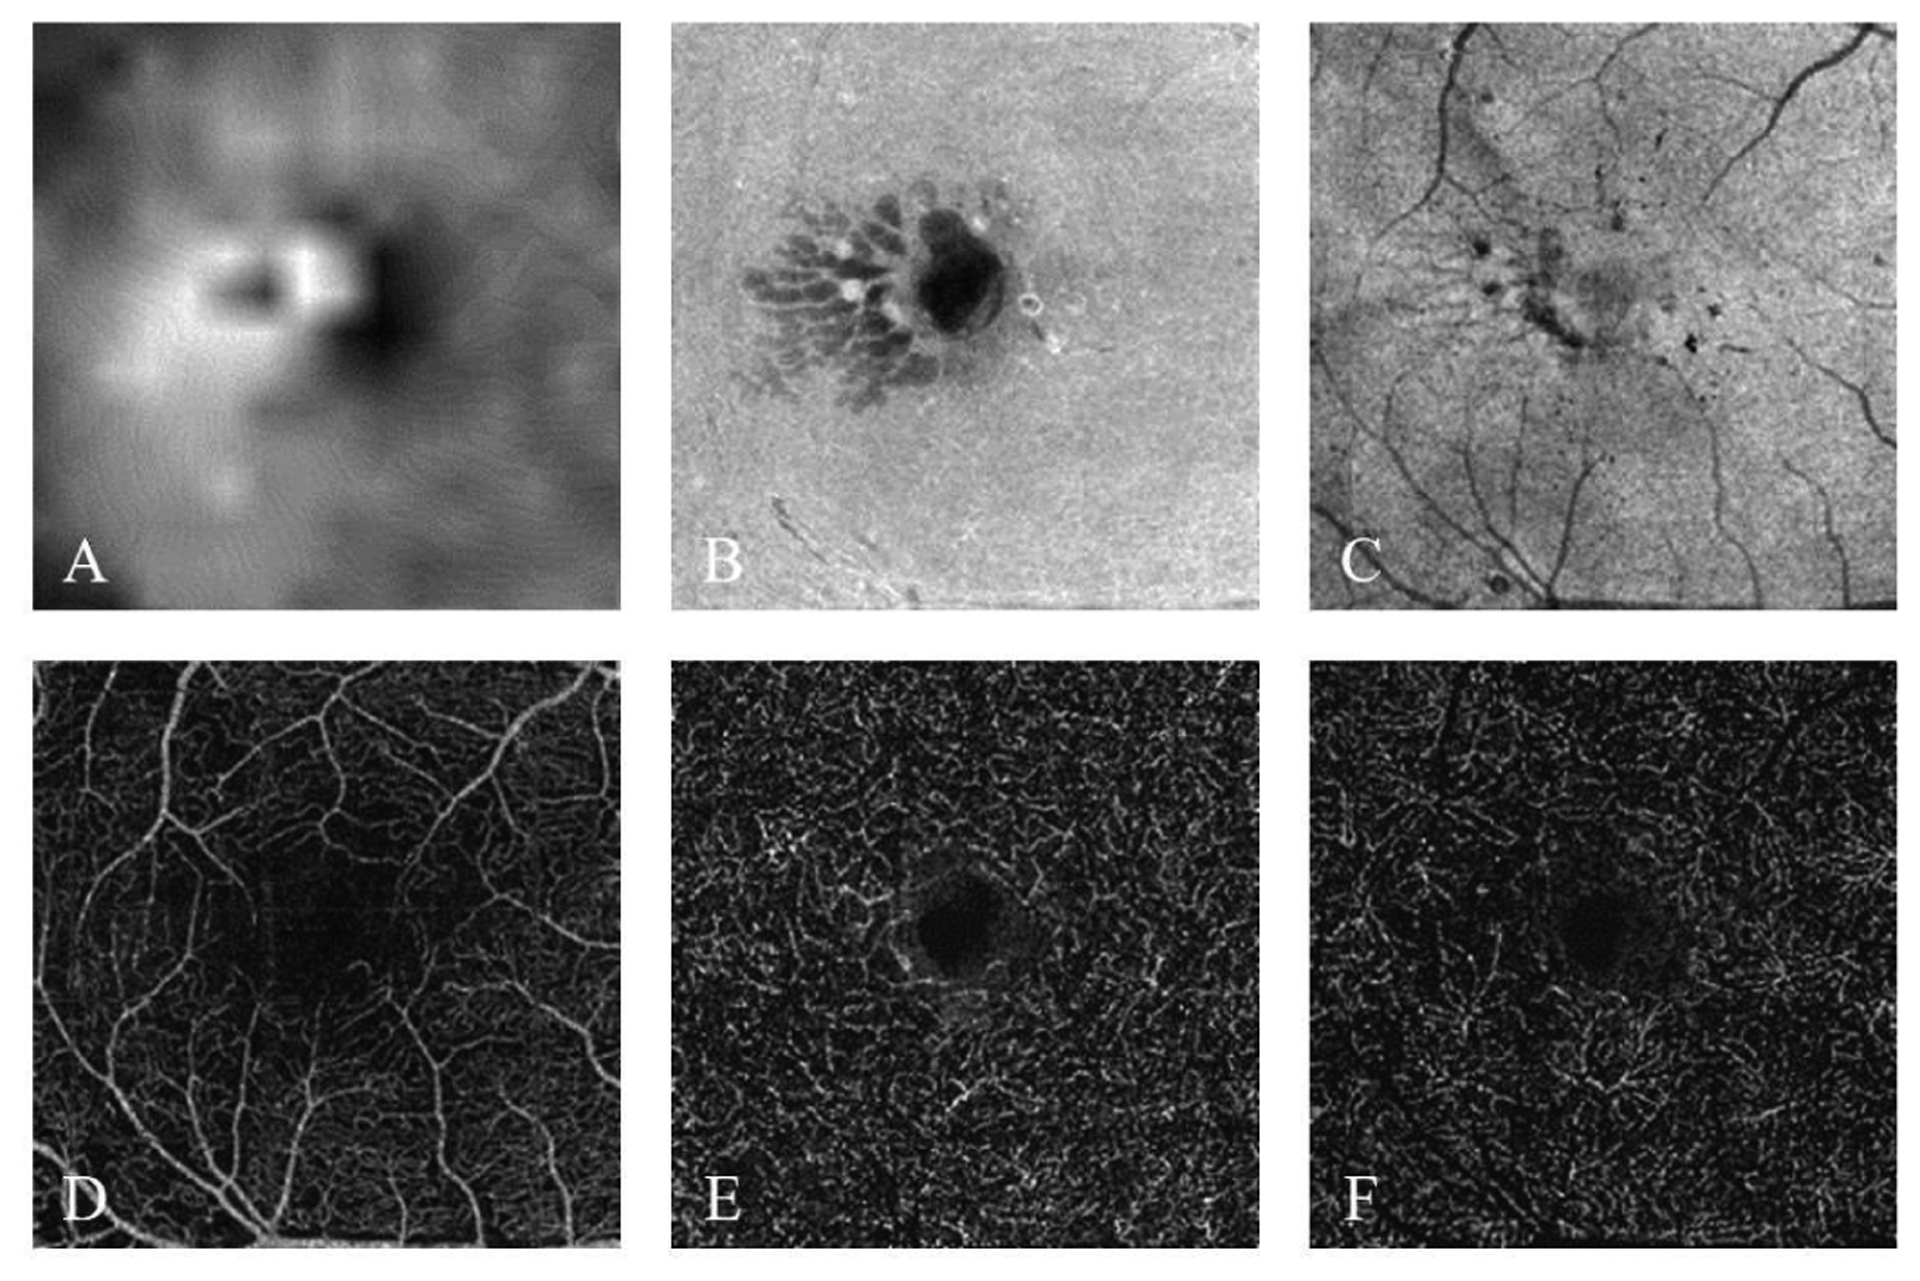
Fig. 2.

The six input channels based on the OCT and OCTA data scanned from a moderate NPDR participant. (A) Inner retinal thickness map. (B) Inner retinal en face average projection. (C) Ellipsoid zone (EZ) en face average projection. (D) Superficial vascular complex (SVC) en face maximum projection. (E) Intermediate capillary plexus (ICP) en face maximum projection. (F) Deep capillary plexus (DCP) enface maximum projection.
