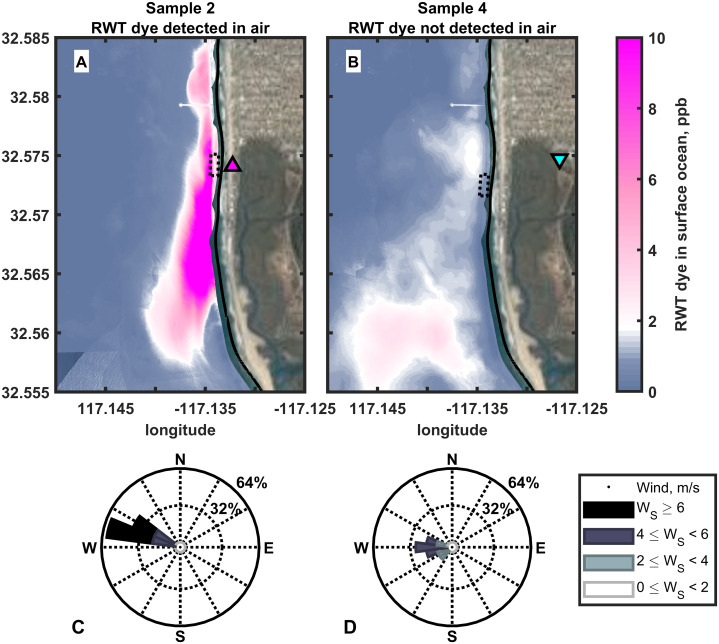
Figure 2. Mean sea surface dye concentrations upwind of aerosol sampling locations.
(A) and (B) show average sea surface dye concentrations during the period each aerosol sample was collected at the location on land indicated by the triangle (5–7). The 200 m × 100 m dotted black box indicates where the average wind direction during each sampling interval intersected the coastal waters from the sampling site. Figure 3 finds the location of that box and its mean dye value for each hourly sea surface dye measurement. Here we show the mean dye field during each air sampling period and the mean upwind location (box). (C) and (D) are wind roses for the winds observed at the KNRS meteorological station during the aerosol sampling periods (8). Aerosol sample 2 (A & C) contained dye and was collected downwind of high dye concentrations in coastal water. Aerosol sample 4 (B & D) did not contain detectable dye and was collected downwind of seawater containing very low dye concentrations near the detection limit. (5) Zohar Bar-Yehuda (2017). zoharby/plot_google_map (https://github.com/zoharby/plot_google_map), GitHub. Retrieved June 1, 2017. (6) Map data: Imagery ©2020 Google. Data USGS, Data SIO, NOAA, U.S. Navy, NGA, GEBCO, Data LDEO-Columbia, NSF, NOAA, Imagery ©2020 TerraMetrics, Map data ©2020 INEGI. (7) Jonathan Sullivan (2017). Automatic Map ScaleGeneration (https://www.mathworks.com/matlabcentral/fileexchange/33545-automatic-map-scale-generation), MATLAB Central File Exchange. Retrieved June 1, 2017. (8) Daniel Pereira (2017). Wind Rose (https://www.mathworks.com/matlabcentral/fileexchange/47248-wind-rose), MATLAB Central File Exchange. Retrieved June 1, 2017.

