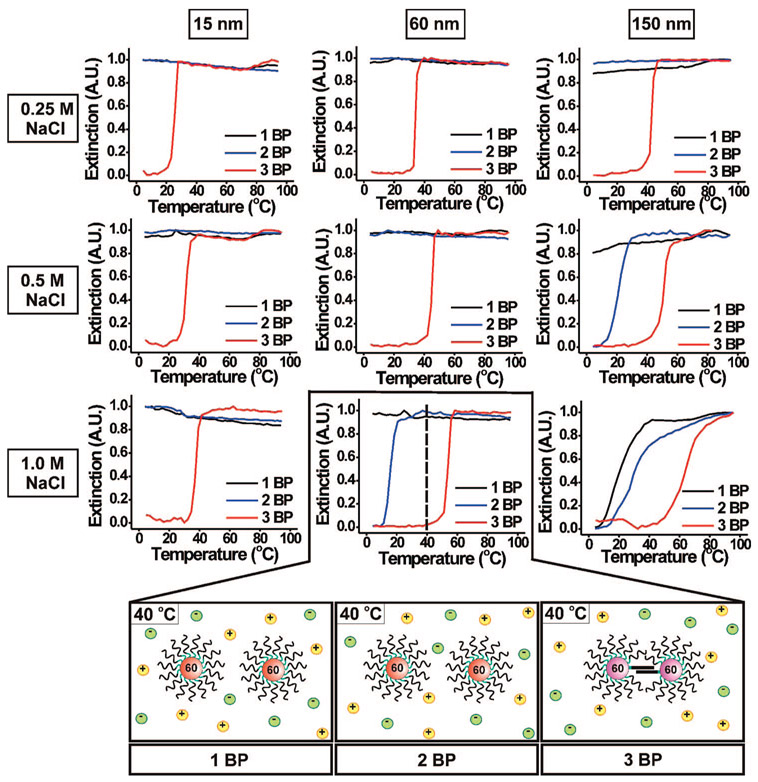
Figure 6.
Normalized melting curves (monitored at 260 nm) for 15, 60, and 150 nm DNA–Au NP aggregates at 0.25, 0.5, and 1.0 M NaCl. Each graph shows the effect of changing the number of base pairings (1, 2, or 3 BP) on the melting transition. In the case of the 60 nm DNA–Au NPs, at 40 °C in 1.0 M NaCl, those functionalized with 3 BP form aggregates, while those functionalized with 1 BP and 2 BP do not (bottom graphics).

