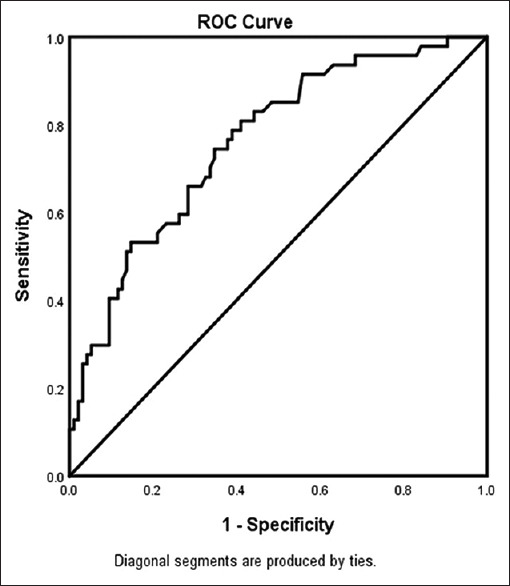
Figure 4.

ROC curve associated with prediction of having a National Institutes of Health Stroke Scale score >7 for acute ischemic stroke patients with sleep apnea. Classification table (overall correctly classified percentage = 71.9%) and area under the ROC curve (Area under the ROC Curve = 0.761, 0.679–0.843) were applied to check model fitness
