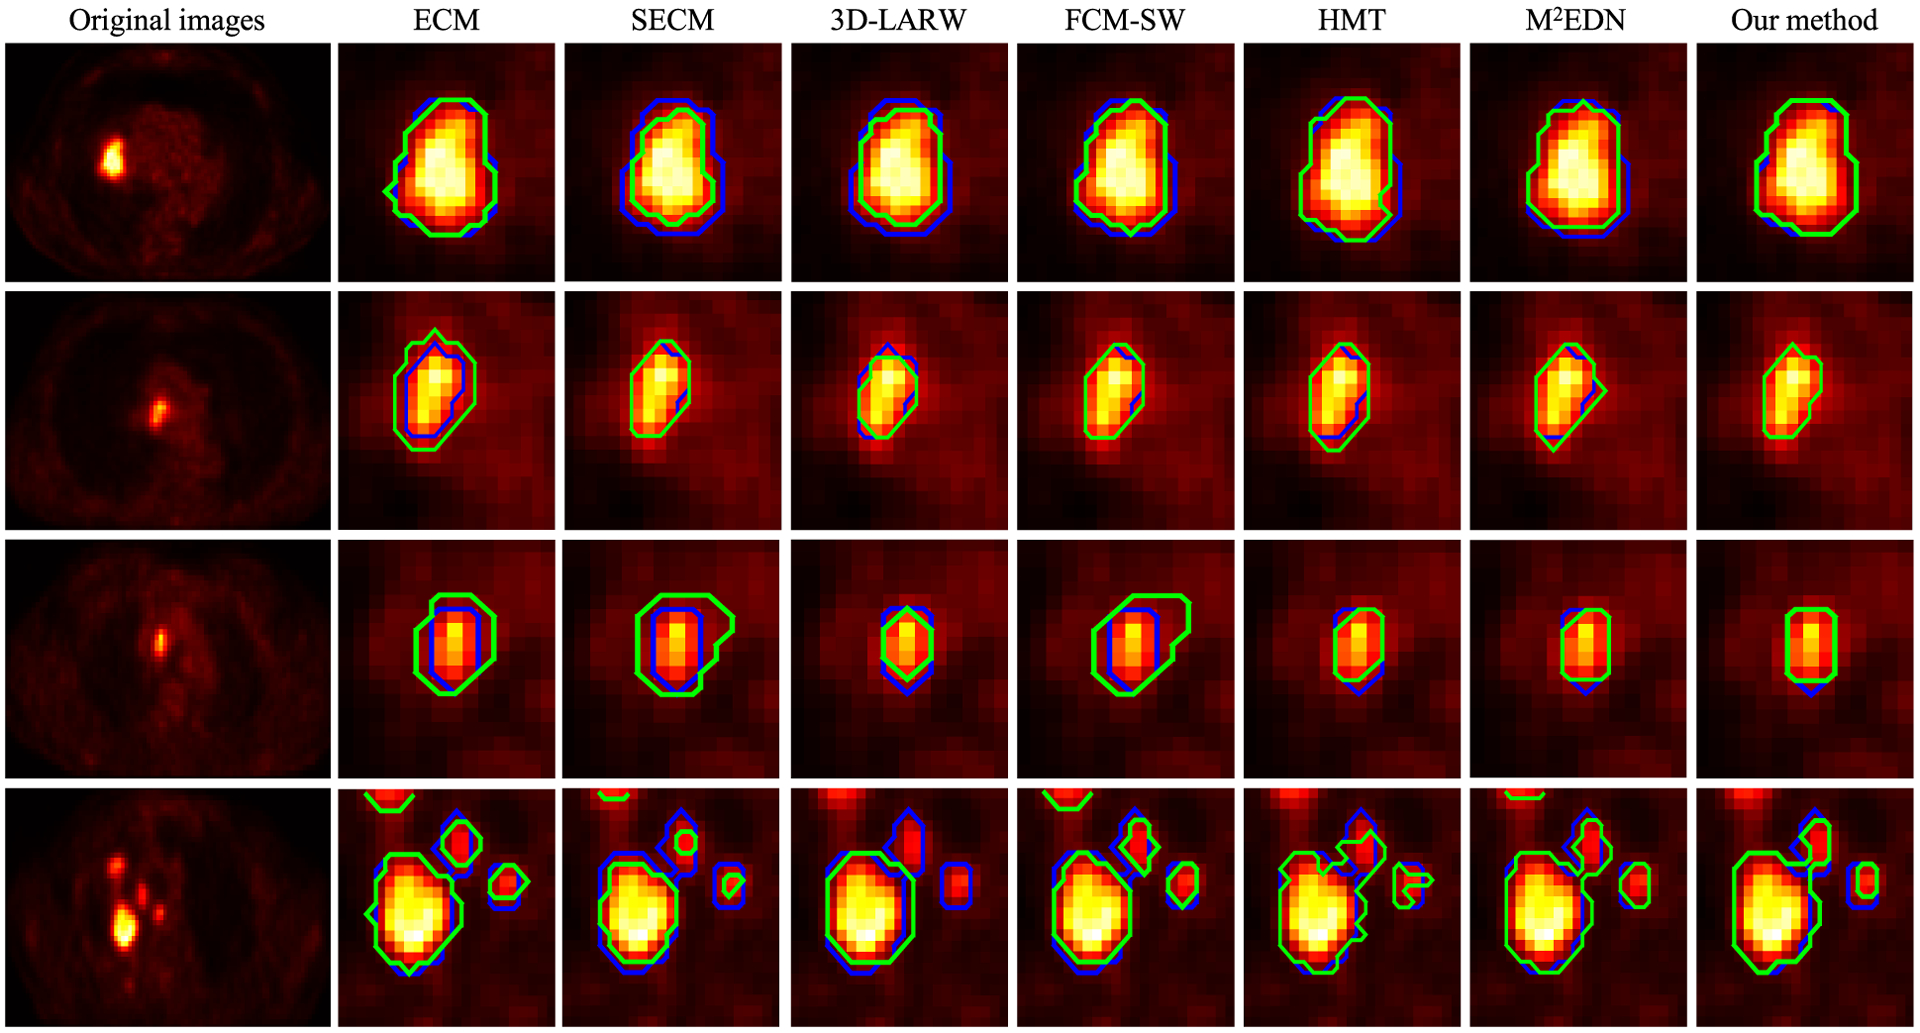
Fig. 5.

Contours delineated by different methods (from the second column to the last column) for four different tumor volumes shown in the axial plane. The first column represents the input images. The contours delineated by the automatic/semi-automatic methods (green lines) are compared with those by clinicians (blue lines) in the following columns.
