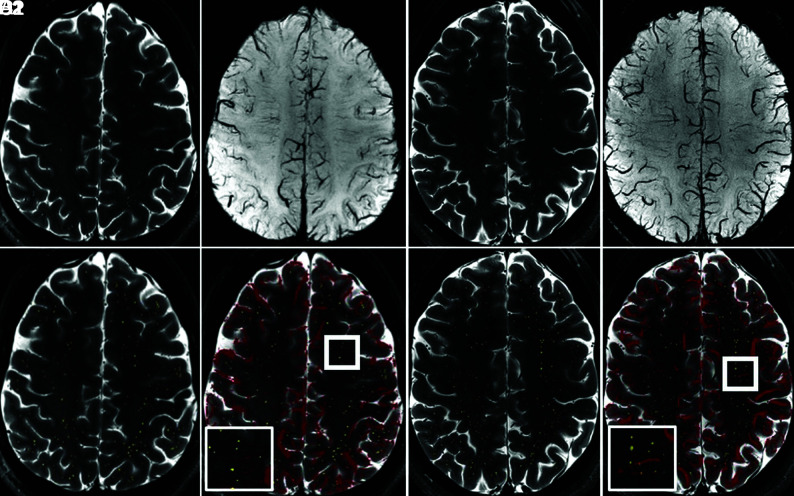
FIG 1.
Overlay of pre- and postprocessed images of T2-TSE with manual PVS markings and SWI at 7T in a healthy control (A–D 1) and a person with MS (A–D 2) allows identification of venular and nonvenular PVSs. T2-TSE (A), SWI (B), T2-TSE with PVSs highlighted in yellow (C), and T2-TSE with SWI overlay in red (D) are depicted, with magnification of 1 sample area in the thick white square demonstrated in the thinner white square inset.

