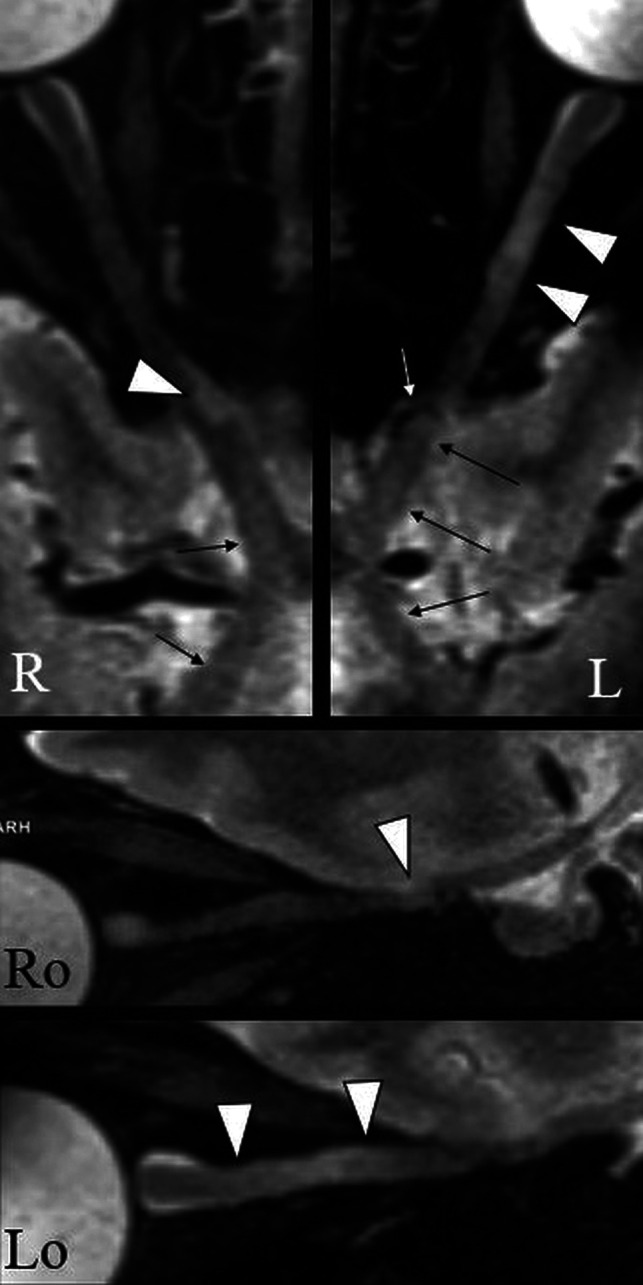
FIG 3.

An example of the DL appearance on 3D-T2-STIR-ZOOMit images in a patient with MS (No. 0034). The upper panel shows curved reconstructions along the true long axis of the right and left aVPs. Focal signal hyperintensities indicate DLs with partial (right) and complete (left) involvement of the optic nerve cross-section (arrowheads). There are areas of diffuse signal hyperintensity with no definite boundaries along the aVP (thin arrows), possibly related to diffuse demyelination and/or degeneration. The white arrow indicates the ophthalmic artery causing nerve impression. Ro and Lo images present sagittal-oblique reconstructions of R and L.
