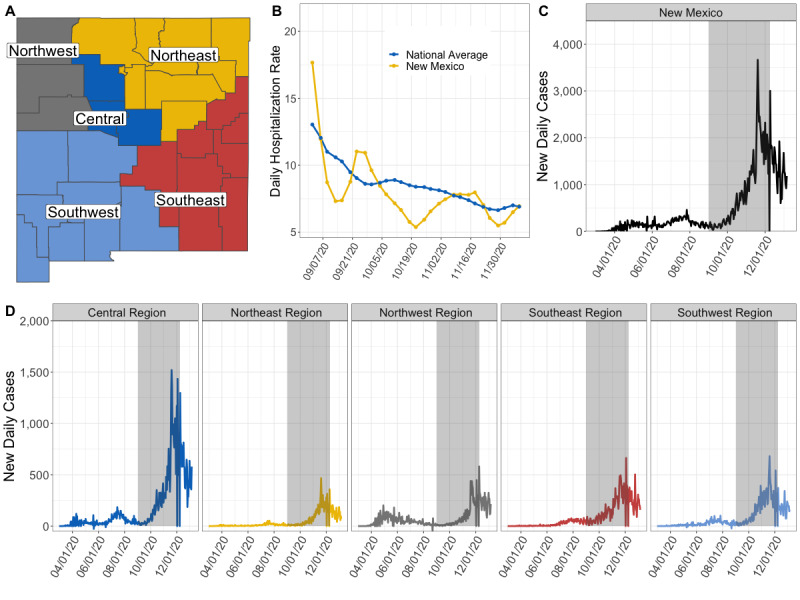
Figure 1.

New Mexico health regions, COVID-19 confirmed case time series from March 2020 to January 2021, and daily hospitalization rates from September to December 2020. (A) Division of New Mexico’s 33 counties into five health regions. (B) The 2-week weighted daily hospitalization rate for New Mexico (yellow) compared to the national average (blue) (C). The number of new daily cases at the state level, with the grey box denoting the period of forecast performance evaluation. (D) The number of new daily COVID-19 cases for each of the five regions.
