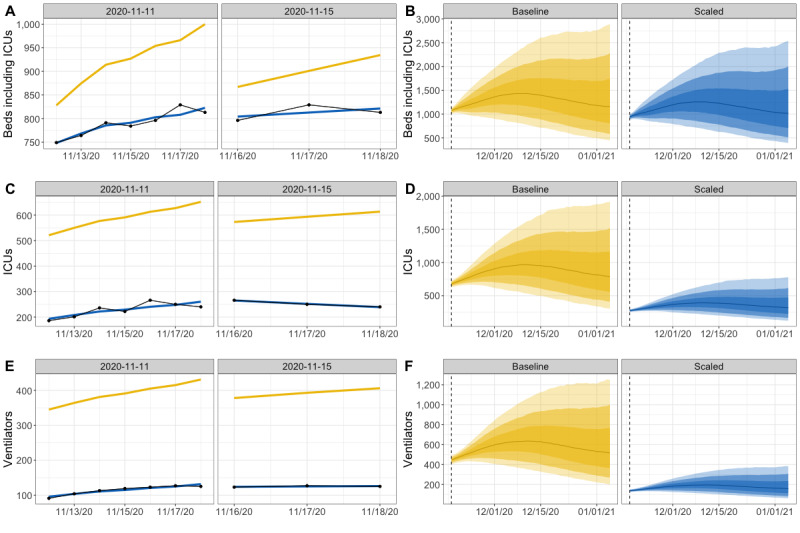
Figure 2.

Back-fitting procedure for the November 18, 2020, forecast for New Mexico. (A, C, E) For each forecast from over the week (the panels), a regression was fit (blue line) from the 50th percentile of the baseline forecasts (yellow line) to the observed data (black dots). A time-weighted average of the 2 regression coefficients from each panel was calculated separately for inpatient beds (A), ICU beds (C), and ventilators (E). (B, D, F) For the November 18 forecast, the Baseline forecast was multiplied by the time-weighted average of the regression coefficients to produce the Scaled forecast for the next four weeks. ICU: intensive care unit.
