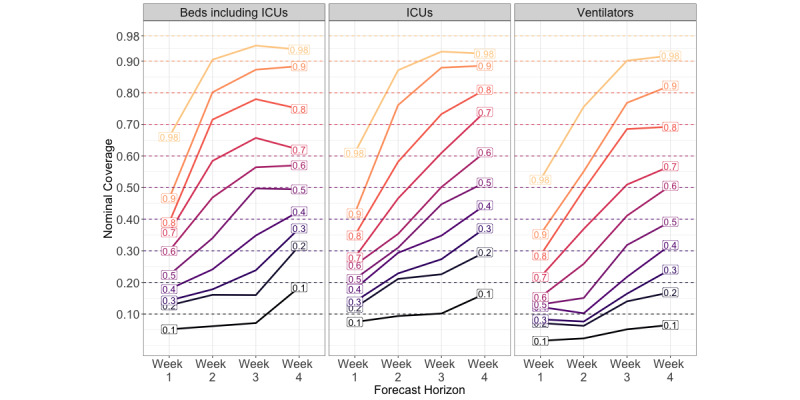
Figure 5.

Coverage plot for New Mexico state-level forecasts at 4-week ahead horizons made between September 1 and December 9, 2020. Colored lines are labeled by their nominal coverage, while the position on the y-axis indicates its empirical coverage. If a forecast is well-calibrated, the empirical coverage should fall along the y-axis at its corresponding nominal coverage. ICU: intensive care unit.
