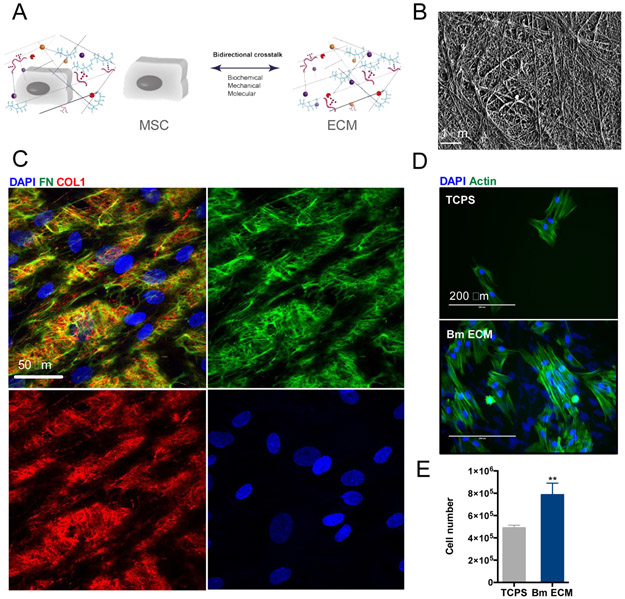
Figure 1: ECM produced by Bm MSC in vitro.
(A): Bidirectional interactions between MSC and ECM regulate cell function. (B): Electron microscopy of Bm ECM reveals a fibrillar structure. Scale bar is 1 μm. (C): Immunostaining of Bm MSC on their ECM after 14 days using fibronectin antibody (green, top right picture), collagen I antibody (red, bottom left picture) and DAPI (cell nuclei, blue, bottom right picture). The overlay is shown in top left picture. Scale bar is 50 μm. (D): Fluorescence microsopy images of Bm MSC on TCPS (top) or Bm ECM (bottom) after 3 days of culture. Actin cytoskeleton was stained with Alexa Fluor® 488 Phalloidin and cell nuclei with DAPI; scale bar is 200 μm. (E): Number of Bm MSC after 3 days of culture on Bm ECM (blue bar) or TCPS (grey bar). Results show mean ± SD of three independent experiments performed in triplicate. Statistics were done using unpaired t-test (**p<0.01).

