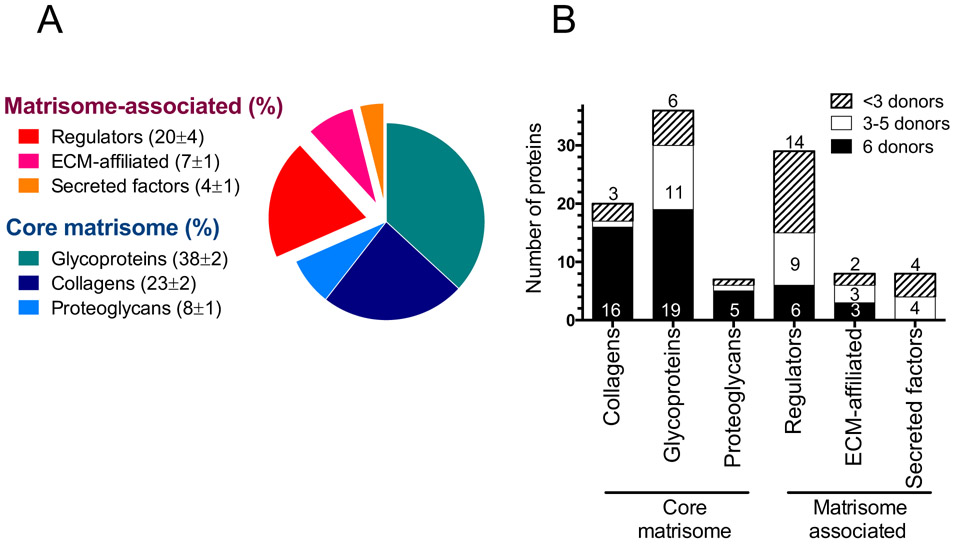
Figure 2: Proteomic characterization of ECM produced by Bm MSC from different donors.
(A): Matrisome signature of Bm ECM. Pie chart represents the distribution of Bm ECM proteins by percentage of total number for each matrisome protein sub-category. The average percentage ± SD for each sub-category was calculated for the 6 donors and is presented in the parentheses. (B): Protein distribution among donors. Columns represent the number of proteins for each matrisome sub-category detected in all donors (black bars), 3 to 5 donors (white bars) or fewer than 3 donors (hatched bars). Proteins represented by at least 1 peptide are included. Results were collected from two technical replicates of two independent experiments.

