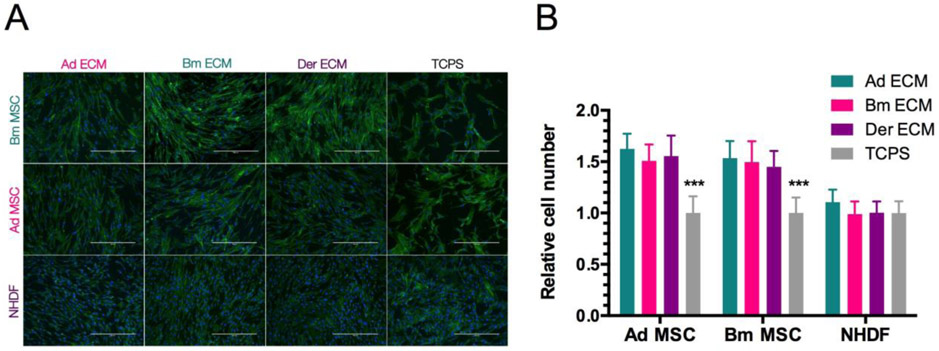
Figure 5: Cell survival on the different matrices.
(A): Fluorescence microscopy pictures with actin cytoskeleton staining (Alexa Fluor® 488 Phalloidin) and cell nuclei (DAPI). Scale bar is 400 μm. (B): Cell number relative to TCPS after 3 days in culture. Results show mean ± SD of two independent experiments (n=6). Statistics were done using two-way ANOVA and Tukey’s post test (***p<0.001).

