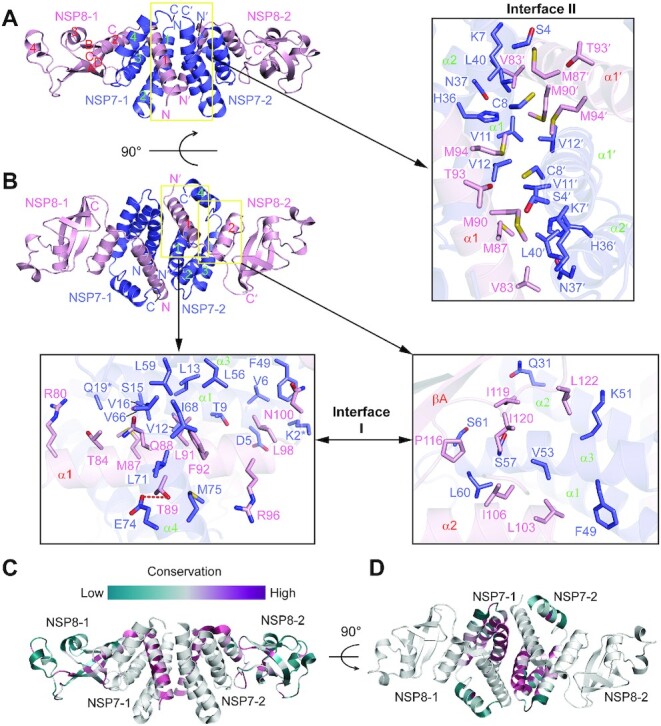
Figure 2.

Crystal structure of the SARS-CoV-2 NSP7-NSP8 complex. (A, B) Orthogonal views of the SARS-CoV-2 NSP7-NSP8 complex, with the intermolecular interactions at the two oligomer interfaces shown in expanded views. The interacting residues are shown in stick representation. The hydrogen bond is shown as a red dashed line. The side chains of NSP7 K2 and Q19, which are untraceable in the crystal structure, are marked by asterisks. (C, D) Color-coded sequence conservation of SARS-CoV-2 NSP8 (C) and NSP7 (D), analyzed using the ConSurf server (https://consurf.tau.ac.il/) (33).
