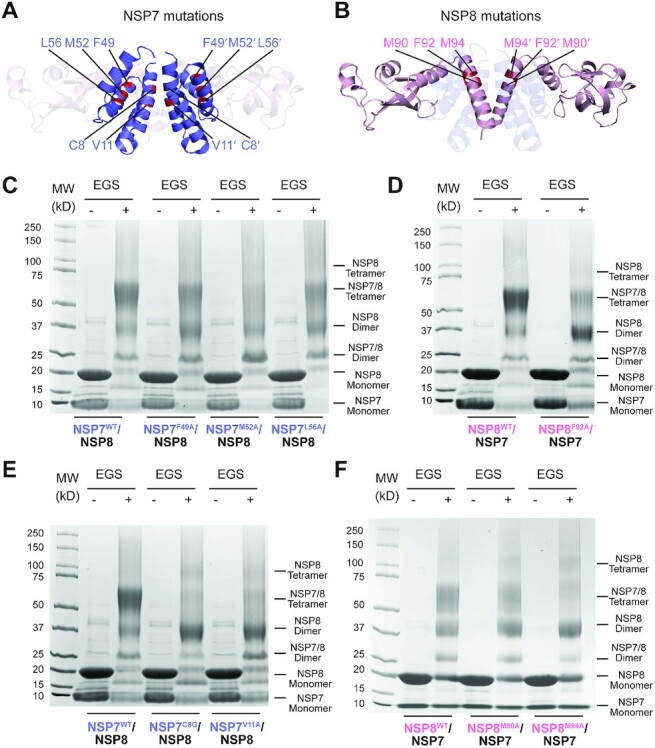
Figure 3.

Mutational analysis of the SARS-CoV-2 NSP7–NSP8 interaction. (A) Residues mutated in NSP7. (B) Residues mutated in NSP8. (C, D) SDS-PAGE images of the NSP7-NSP8 complex, WT or mutant on the interface I of NSP7 (C) or NSP8 (D), in the presence and absence of EGS crosslinker. (E, F) SDS-PAGE images of the NSP7–NSP8 complex, WT or mutant on the interface II of NSP7 (E) or NSP8 (F), in the presence and absence of EGS crosslinker.
