Figure 3.
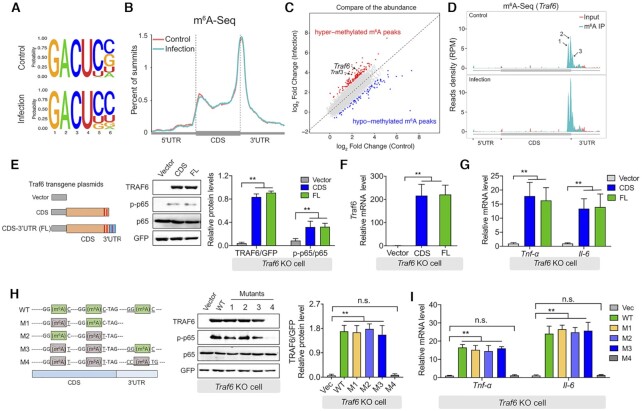
Translation of the Traf6 transcript requires m6A methylation. (A) Sequence motifs within the m6A peaks were identified using Homer software. (B) Metagene plot showing virtually identical m6A peak distributions in control IPEC-J2 cells and IPEC-J2 cells 3 h after ETEC infection. The 5′ UTR, coding sequence (CDS), and 3′ UTR in the Traf6 transcript are indicated. (C) Summary of differentially expressed m6A-modified transcripts measured by comparing ETEC-infected IPEC-J2 cells and uninfected cells. (D) RNA-Seq analysis of input RNA and immunoprecipitated (IP) m6A RNA in Traf6 transcript. The three m6A motif sequences that correspond to an immunoprecipitation-enriched region are shown in green. (E) Rescue experiment in LPS-stimulated Traf6 KO IPEC-J2 cells expressing the indicated FLAG-tagged Traf6 plasmids. (F, G) Summary of Traf6 (F) and Tnf-α and Il-6 (G) mRNA levels measured in the cells show in (E), expressed relative to Gapdh mRNA. (H) Western blot analysis and summary of TRAF6, p65, and p-p65 in LPS-stimulated Traf6 KO IPEC-J2 cells expressing the indicated Traf6 plasmids. The left panel shows the various plasmid with mutations in the indicated m6A sites in the Traf6 transcript. (I) Summary of Tnf-α and Il-6 mRNA levels measured in the cells shown in (H), expressed relative to Gapdh mRNA.

