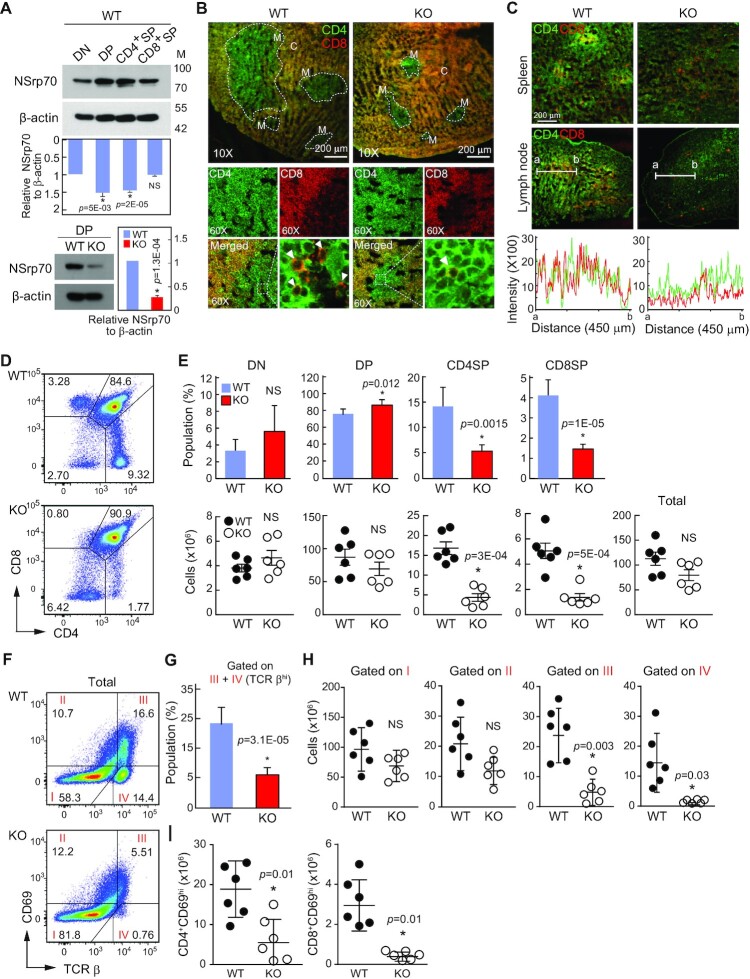
Figure 2.
Development of CD4+ and CD8+ SP thymocytes is impaired in Nsrp1f/fCD4Cre mice. (A) Western blot of NSrp70 expression in thymocyte subsets from Nsrp1f/f (WT) and Nsrp1f/fCD4Cre (cKO) mice. DN, double negative; DP, double positive; SP, single positive; WT, Nsrp1f/f mouse; KO, Nsrp1f/fCD4Cre mouse. The bar graphs indicate the mean ± standard deviation (SD) of the indicated protein blot densitometry presented with respect to β-actin. (B and C) Staining for CD4 (green) and CD8 (red) in thymus (B) and in spleen and lymph node (C) from 6-week-old WT and KO mice. White arrowheads: CD8+ SP thymocytes in medulla. M, medulla; C, cortex. Original magnification, ×10. The fluorescent intensity of CD4+ and CD8+ thymocytes was quantified (C, bottom). (D) Flow cytometric analysis of CD4 and CD8 on thymocytes. (E) Quantification of average percent (top) and cell numbers (bottom) of DN, DP, CD4+ or CD8+ SP thymocyte subpopulations. Each black and white circle in graphs of cell numbers represents an individual mouse. The bar graphs (top) and small horizontal lines (bottom) indicate the mean ± SD. *, meaningful P-value; NS, non-significant P-value. (F) Surface staining of TCRβ and CD69 on total thymocytes. (G–I) Quantification of TCRβhi thymocytes population gated on III and IV (G), total cell numbers gated on I–IV gate plots (H), and CD4+CD69hi and CD8+CD69hi cells (I) from panel (F). The bar graphs indicate the mean ± SD of populations. hi, high expression. Each black and white circle in graphs represents an individual mouse. The small horizontal lines indicate the mean ± SD. All data shown are representative of three independent experiments.

