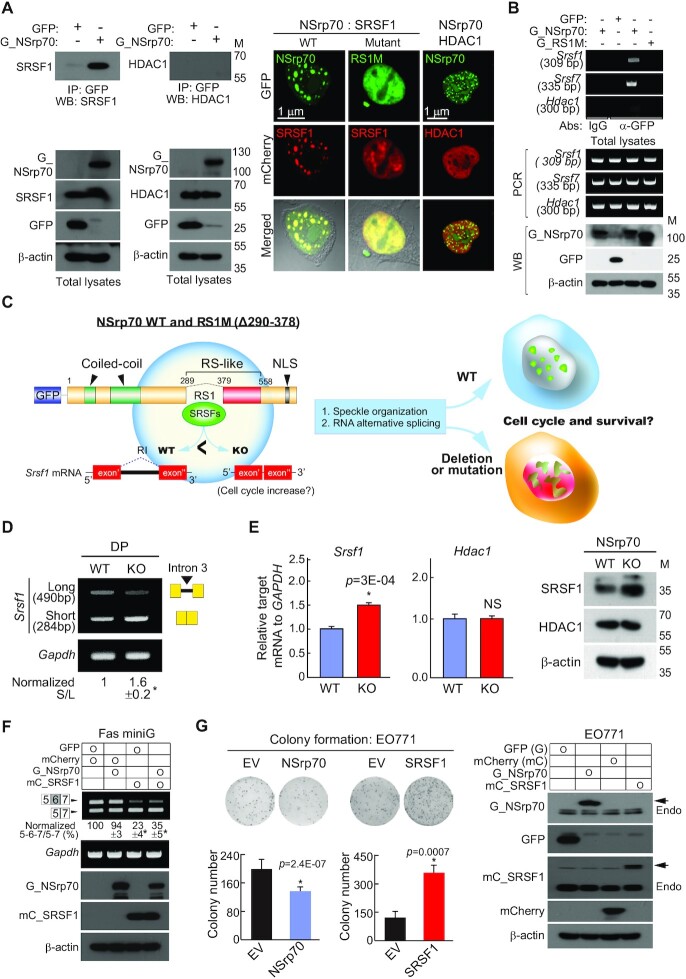
Figure 4.
NSrp70 controls the expression of SRSF1 and counteracts mutually. (A) Immunoprecipitation (left) and immunofluorescence images (right) of NSrp70 and SRSF1. HEK293T cells were transfected with GFP (empty vector), GFP_NSrp70 (G_NSrp70), or RS1M mutant. In some cases, mCherry-fused SRSF1 and HDAC1 were co-transfected. Samples were immunoprecipitated and blotted with antibodies against the indicated proteins (left). IP, immunoprecipitation; WB, western blotting; M, molecular mass (kDa). Fluorescence signals were visualized under a confocal microscope (right). Magnification, 100×. Results are representative of three independent experiments. (B) RIP assay for validation of NSrp70-binding mRNA. The samples in (A) were immunoprecipitated with the indicated antibodies (anti-rabbit IgG or anti-GFP). RNAs purified from the IP samples and total lysates were determined by RT-PCR. bp, base pair. (C) Schematic diagram of wild-type NSrp70 and RS1M mutant. Potential regulation of alternative splicing and speckle organization by NSrp70 and its effect on T cell development. NLS, nuclear localization sequence. (D) RT-PCR analysis of different SRSF1 isoforms in Nsrp1f/f (WT) and Nsrp1f/fCD4Cre (KO) DP thymocyte. (E) Real-time quantitative PCR (left) and western blot analysis (right) for SRSF1 and HDAC1 from WT and KO DP thymocytes. Gapdh and β-actin were shown as the loading controls. *, meaningful P-value. (F) NSrp70 counteracts SRSF1 in vivo splicing assay. HEK293T cells were co-transfected with the indicated constructs and Fas minigene. Exon inclusion or exclusion was determined by RT-PCR (top). The ratio of exclusion or inclusion of Fas exon 6 is shown as the normalized ratio (%) (middle). mCherry, empty vector; mC_SRSF1, mCherry_SRSF1. (G) NSrp70 effects on the proliferation of EO771 cancer cells. The cells were stably transfected with NSrp70, SRSF1, or a control vector and analyzed by colony formation assays with mean ± standard deviation of relative colony numbers plotted (left). Expression of NSrp70 and SRSF1 were confirmed (right). All data shown are representative of three independent experiments. *, meaningful P-value.

