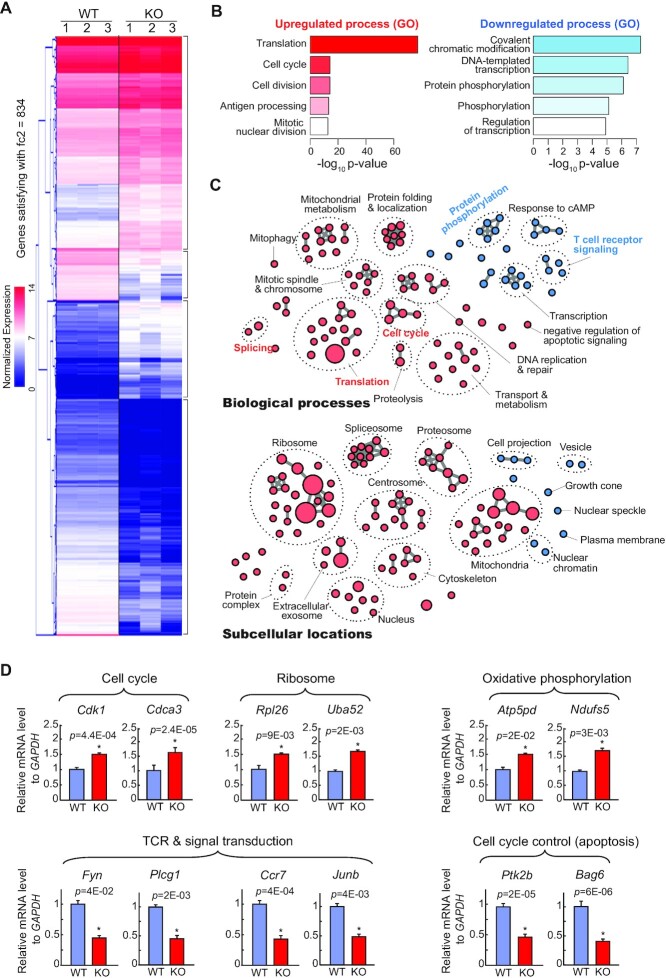
Figure 5.
Aberrant gene expression related to the cell cycle and TCR intracellular signal transduction in NSrp70-cKO DP thymocytes. (A) Hierarchical clustering of gene expressions with more than two-fold changes. We found distinct gene clusters of up- or down-regulation in Nsrp70-cKO DP thymocytes. The heat-map for gene expression patterns was generated using the Multi Experiment Viewer (MeV) software. Genes with red and blue colors indicate higher and lower expressions, respectively. fc2, 2-fold change. (B) Top-5 most significantly up-regulated or down-regulated biological process terms from significantly differentially expressed genes (negative binomial tests) based on gene ontology enrichment tests (modified Fisher's exact tests from DAVID). (C) The global map of significantly up-regulated (pink) or down-regulated (skyblue) gene ontology terms (biological processes and subcellular locations, top and bottom, respectively) by gene ontology enrichment tests (P-value < 0.01). Like in the Enrichment Map (54), we clustered enriched biological processes and subcellular locations as connected in the map if they shared genes in significant numbers (Jaccard > 0.25). (D) Real-time quantitative PCR analysis for the validation of NSrp70-regulated targets. mGapdh was used as the loading control. *, meaningful P-value. All data shown are representative of three independent experiments.

