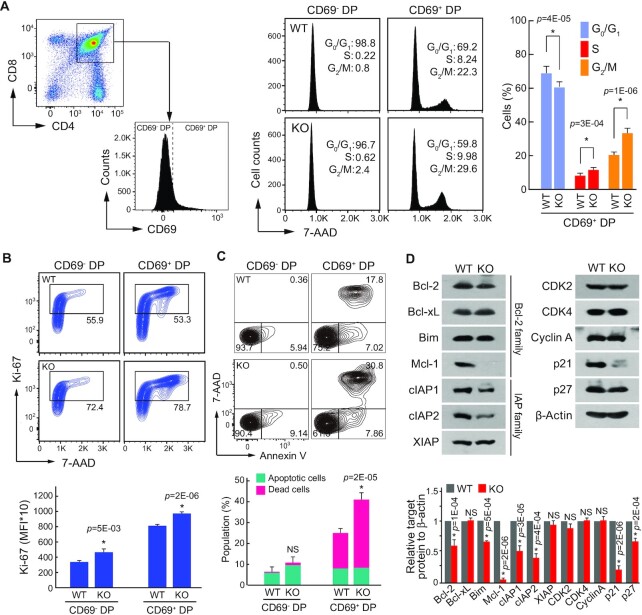
Figure 6.
Deletion of NSrp70 induces uncontrolled cell proliferation followed by apoptotic cell death. (A) Cell cycle analysis of DP thymocytes from Nsrp1f/f (WT) and Nsrp1f/fCD4Cre (KO) mice. Populations of CD69– or CD69+ thymocytes were gated from CD4 and CD8 DP thymocytes (left) and were analyzed for DNA content by 7-ADD intensity (right). The bar graphs indicate average ± SD of different cell cycle stages population. *, meaningful P-value. (B, C) Analysis of cell proliferation by Ki-67 staining and apoptotic cell death by annexin V and 7-ADD. DP thymocytes from (A) were stained with anti-Ki-67 antibody and 7-ADD (B) or annexin V and 7-ADD (C) and analyzed by flow cytometry. Bar graphs indicate mean fluorescence intensities (MFI) (B, bottom). Annexin V+ populations represent early apoptotic cells and annexin V+ and 7-ADD+ populations represent dead cells (C). The bar graphs indicate average ± SD of apoptotic and dead thymocyte populations. NS, non-significant P-value. (D) Western blot of cell cycle and cell death-related proteins in samples extracted from WT and KO thymocytes. β-actin served as a loading control. The bar graphs indicate average ± SD of indicated protein blot densitometry presented relative to β-actin. All data shown are representative of three independent experiments.

