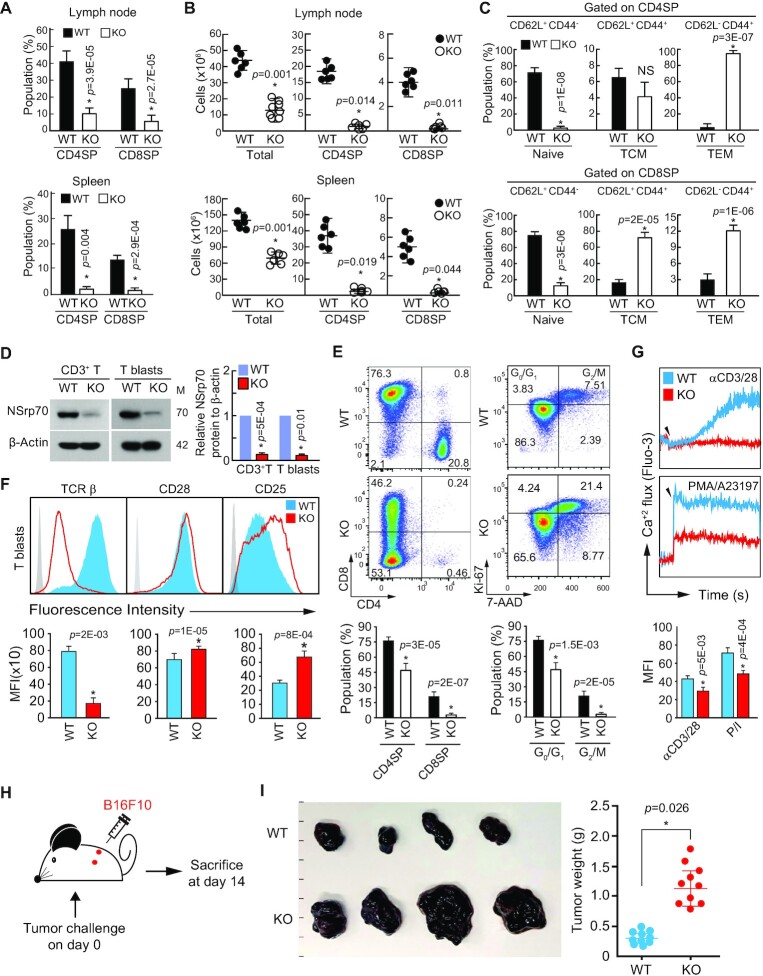
Figure 8.
NSrp70 deficiency results in severe peripheral lymphopenia. (A, B) Flow cytometric analysis of CD4 and CD8 on T cells from lymph node (top) and spleen (bottom) of WT and KO mice. Quantification of CD4+ and CD8+ populations (A) and cell numbers (B) were represented as bar graphs (A) and circle symbols (B). Small horizontal lines indicate the mean ± standard deviation. Each black and white circle represents an individual mouse. *, meaningful P-value. (C) Analysis of CD62L and CD44 on T cells from (A). Numbers in quadrants indicate percent cells in each throughout. (D) Western blot analysis of NSrp70 in CD3+ T cells (left) and anti-CD3/28 and IL-2-induced CD3+ T blasts (right) obtained from WT and KO lymph nodes. M: molecular mass (KDa). β-actin served as a loading control. (E and F) Flow cytometric analysis of CD4+ and CD8+ and Ki-67+ and 7-ADD+ (E) and TCRβ, CD28, and CD25 (F) on CD3+ T blasts from (D). Numbers in the areas indicate percent cells in each throughout. (G) Calcium flux of CD3+ T blasts from (D). Calcium flux was measured as described in Figure 6D. (H) Schematic experimental design of B16F10 tumor model. (I) B16F10 cells were subcutaneously injected into left and right flank of WT and KO mice. Mice were sacrificed after 2 weeks. Tumor sizes and weights were determined. All data shown are representative of three independent experiments. *, meaningful P-value.

