Figure 6.
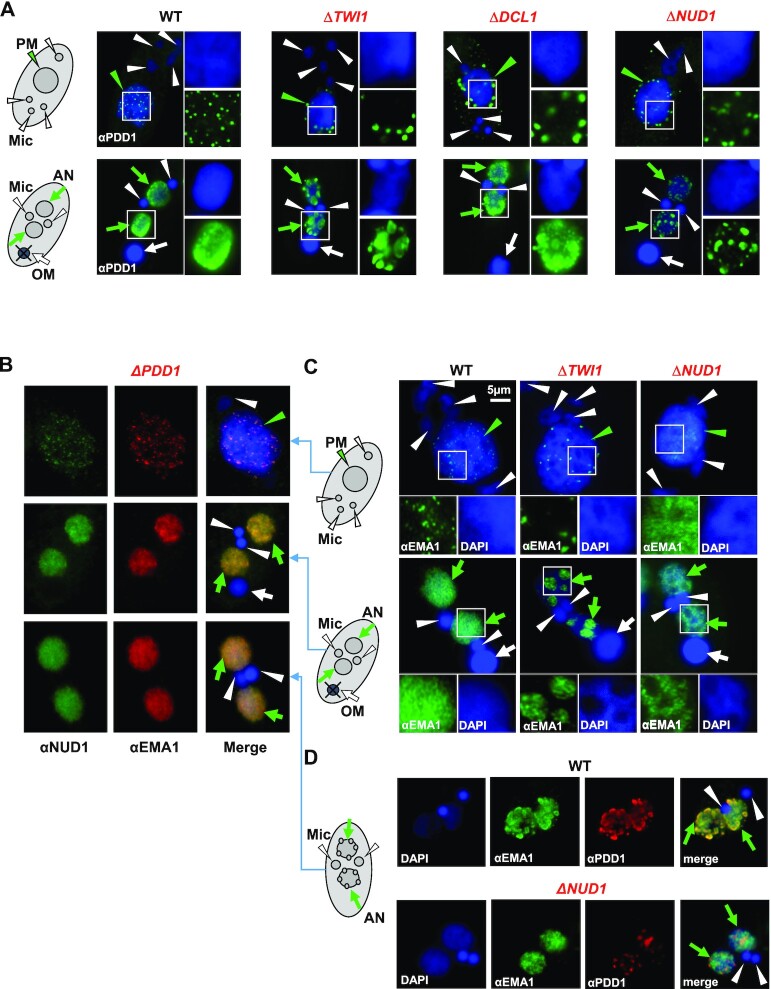
The EZL1 complex and PDD1 drive coalescence of Polycomb bodies. (A) RNAi-dependent localization of PDD1. WT and the designated RNAi mutants at early (top panels: 6 h post-mixing) and late conjugation (bottom panels: 10 h post-mixing) were stained with the anti-PDD1 antibody (green) and counterstained with DAPI (blue). Parental MAC (PM): green arrowhead; developing MAC (AN): green arrows; MIC (Mic): white arrowheads; old MAC (OM): white arrow. Granularity analysis of the PDD1 foci in the images was provided in Supplemental Figure S11C. (B) Co-localization of the EZL1 complex and EMA1 in ΔPDD1 cells. Cells at different conjugation stages (6, 10 and 14 h post-mixing; see schematics to the right) were co-stained with the anti-NUD1 (green) and anti-EMA1 (red) antibodies; counterstained with DAPI (blue). Note their abnormal dispersion, even at the late anlagen development stage. The EZL1 complex and EMA1 overlap even in this altered distribution, consistent with their co-IP in ΔPDD1 cells (Figure 3G). (C) Opposite EMA1 localization patterns in ΔTWI1 and ΔNUD1. WT and the mutants at early (top panels: 6 h post-mixing) and late conjugation (bottom panels: 10 h post-mixing; see schematics to the left) were stained with the anti-EMA1 antibody (green) and counterstained with DAPI (blue). Note abnormal aggregation of EMA1 in DAPI-poor regions in ΔTWI1, as well as its dispersion in DAPI-rich regions in ΔNUD1 cells (insets). (D) Co-localization of EMA1 and PDD1 disrupted in ΔNUD1 cells. WT and the mutant at late conjugation (14 h post-mixing; see schematics to the left) were sequentially stained with the anti-EMA1 (green) and anti-PDD1 (red) antibodies; counterstained with DAPI (blue). Note in the mutant abnormal dispersion of EMA1 in DAPI-rich regions, while PDD1 aggregated in DAPI-poor regions.

