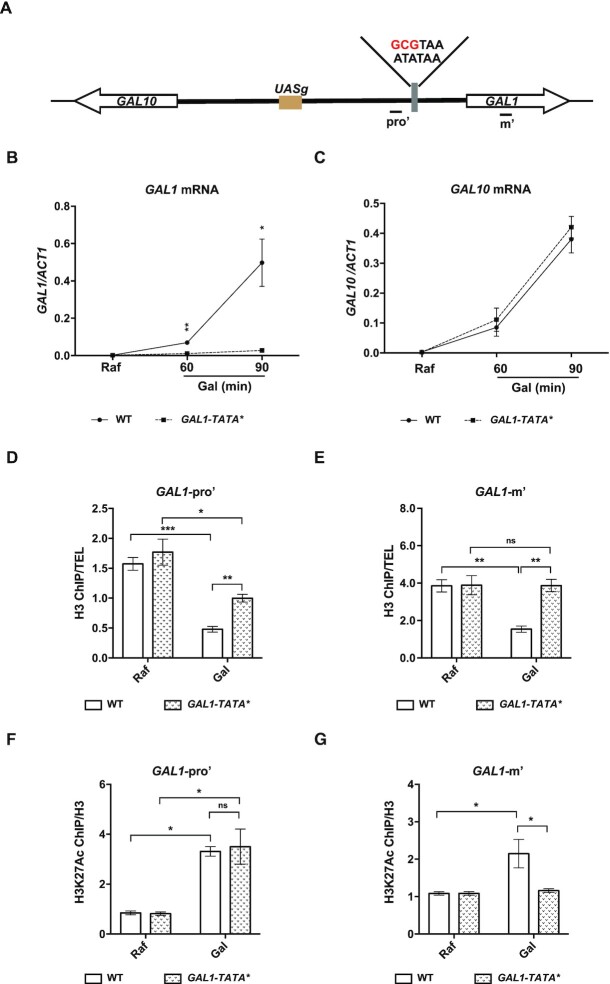
Figure 5.
Nucleosome removal at the GAL1 promoter upon induction impacts on the transcription of GAL genes. (A) A 3-bp substitution mutation within the GAL1 promoter TATA box region that can disrupt the binding of TATA-binding protein to the promoter is shown. Primers at the GAL1 promoter region (pro’) and the gene body region (m’) are shown. (B and C) GAL1 and GAL10 mRNA levels in cells with a GAL1-TATA mutation (GAL1-TATA*). Cells bearing the GAL1-TATA mutant site were grown in raffinose (Raf) at 30°C and then shifted to 16°C upon galactose (Gal) addition for the times indicated. GAL1 and GAL10 mRNA levels were determined by RT-qPCR and normalized to ACT1 mRNA levels. The average of three biological repeats is shown. The error bars indicate the ±1 standard error; Student’s t test was performed: *P< 0.05, **P< 0.01. (D) Nucleosome changes at the GAL1 promoter regions are compromised upon GAL1-TATA* mutation. WT and GAL1-TATA* mutant cells were grown in raffinose at 30°C and then shifted to medium containing 2% galactose for 40 min. H3 ChIP analysis was performed at the GAL locus in WT and GAL1-TATA* mutant cells. The H3-precipitated DNA was analyzed by quantitative PCR (Q-PCR) using the primer sets indicated in (A), and the levels were normalized to those obtained with a telomeric primer set (TEL). The error bars indicate the ±1 standard error; Student’s t test was performed: *P< 0.05, **P< 0.01; ns, not significant. (E) No apparent nucleosome changes at the GAL1 gene body region were detected upon GAL1-TATA* mutation. The experiment was performed as describe in (D). The error bars indicate the ±1 standard error; Student’s t test was performed: **P< 0.01, ns, not significant. (F) The levels of H3K27Ac at the promoter of GAL1 are increased upon GAL1-TATA* mutation. H3K27Ac ChIP analysis was performed in WT and GAL1-TATA* mutant cells as in (D). The H3K27Ac-precipitated DNA was analyzed by Q-PCR using the primer sets indicated in (A) and then normalized to the H3 occupancy. The average of three biological repeats is shown. The error bars indicate the ±1 standard error; Student’s t test was performed: *P< 0.05; ns, not significant. (G) No detectable changes of H3K27Ac levels at the gene body of GAL1 upon GAL1-TATA* mutation. H3K27Ac ChIP analysis was performed in WT and GAL1-TATA* mutant cells as in (F). The H3K27Ac-precipitated DNA was analyzed by Q-PCR using the primer sets indicated in the top panel (B) and then normalized to the H3 occupancy. The average of three biological repeats is shown. The error bars indicate the ±1 standard error; Student’s t test was performed: *P< 0.05, ns, not significant.

