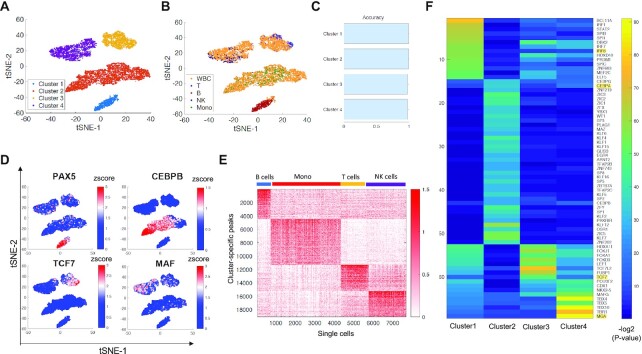
Figure 2.
iscDNase-seq detects different sub cell types in human white blood cells and their specific regulatory regions. (A) A t-SNE visualization of cells with annotation of cells using the cluster information. (B) A t-SNE visualization of cells using the cell type information including the human WBCs, sorted B cells, sorted T cells, sorted NK cells, and sorted monocytes. (C) A bar plot showing the accuracy of cell clusters. (D) A t-SNE visualization of cells with the accessibility of selected TF genes. The color level indicates the zscore of accessibility across all the cells. Four TF genes were selected including (top left) PAX5, (top right) CEBPB, (bottom left) TCF7 and (bottom right) MAF. (E) The cluster-specific peaks show distinct enrichment in different cell types. A heatmap showing the z-score of the normalized read count at the specific peaks for each cluster. (F) Key transcription factor motifs enriched in the cluster-specific DHS peaks. Motif enrichment analysis was performed for each group of top specific peaks. The 80 most significant motifs were selected for each cluster. We eliminated those motifs that existed in more the one cluster. A heatmap was shown for the –log (P-value) for these TF motifs in each cluster.

