Figure 3.
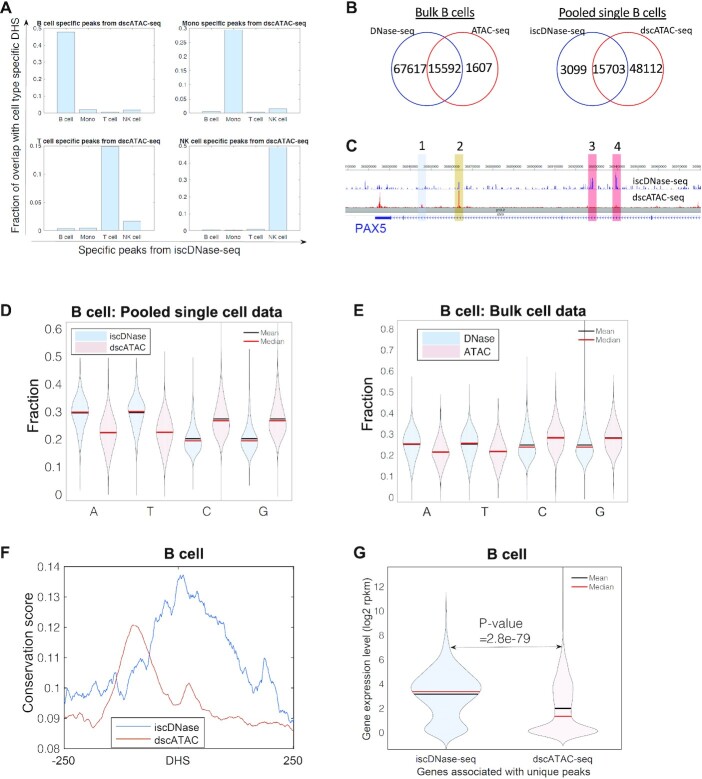
iscDNase-seq predicts functional open chromatin regions. (A) A bar plot showing the overlap between the cell type specific peaks from dscATAC-seq and the cell type specific peaks from the iscDNase-seq. Each subplot refers to the comparison between the cell type specific peaks from dscATAC-seq in one cell type with the cell type specific peaks from iscDNase-seq in four cell types. (B) Venn diagrams showing the overlap between peak sets from bulk DNase-seq and bulk ATAC-seq in B cells (left) and the overlap between the peak sets from iscDNase-seq and dscATAC-seq in B cells (right). (C) A Genome Browser track showing similarities and differences between the iscDNase-seq and dscATAC-seq datasets at the PAX5 gene locus in B cells. (D) A violin plot showing the fraction of nucleotides (A, T, C and G) at the unique peaks from iscDNase-seq and dscATAC-seq for B cells. (E) A violin plot showing the fraction of nucleotides (A, T, C and G) at the unique peaks from bulk cell DNase-seq and bulk cell ATAC-seq for B cells. (F) Sequence conservation scores from B cells for the unique iscDNaseq peaks and unique dscATAC-seq peaks. The unique peaks detected by iscDNase-seq are more likely conserved peaks than those uniquely detected by dscATAC-seq. (G) A violin plot showing the gene expression levels in B cells of genes associated with unique iscDNase-seq, unique dscATAC-seq peaks.

