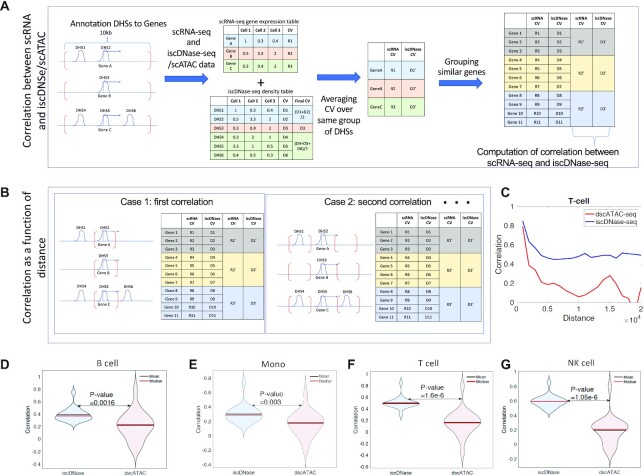
Figure 4.
The cell-to-cell variation in DHS detected by iscDNase-seq is highly correlated with variation in gene expression. (A) A schematic diagram showing the calculation for the correlation between cell-to-cell variation in gene expression and accessibility. First, Genes are annotated to the nearest DHSs located within the selected genomic regions enclosed by the red brackets. Second, we computed the density table and gene expression table for dscATAC-seq/iscDNase-seq and scRNA-seq, respectively. Also, for each gene and DHSs, we computed the coefficient of variation. Third, more than one DHS may be annotated to a gene. If it was the case, an average coefficient of variation (CV) was taken over DHSs which were annotated to the same gene. Forth, 20 genes were grouped in a group based on their CV in accessibility. Fifth, we computed the averaged CV for each group of genes and each assay. Spearman correlation was computed between CV obtained from scRNA-seq and iscDNase-seq/dscATAC-seq over the groups of genes. (B) By varying the selection of the genomic regions enclosed by the red brackets, multiple correlation coefficients are obtained. In particular, the DHS regions closest to the TSSs were first selected. Then the DHS regions with increasing distance from the TSSs were selected. (C) The correlation between cell-to-cell variation in gene expression and accessibility for T cells were plotted as a function of distance, in which distance refers to the distance between the selected genomics regions and the closest TSSs. Correlation for both dscATAC-seq (red) and iscDNase-seq (blue) were computed. (D) A violin plot for correlation between cell-to-cell variation in gene expression and accessibility for B cells for both dscATAC-seq and iscDNase-seq were plotted. (E) A violin plot for correlation between cell-to-cell variation in gene expression and accessibility for monocytes for both dscATAC-seq and iscDNase-seq were plotted. (F) A violin plot for correlation between cell-to-cell variation in gene expression and accessibility for T cells for both dscATAC-seq and iscDNase-seq were plotted. (G) A violin plot for correlation between cell-to-cell variation in gene expression and accessibility for NK cells for both dscATAC-seq and iscDNase-seq were plotted.

