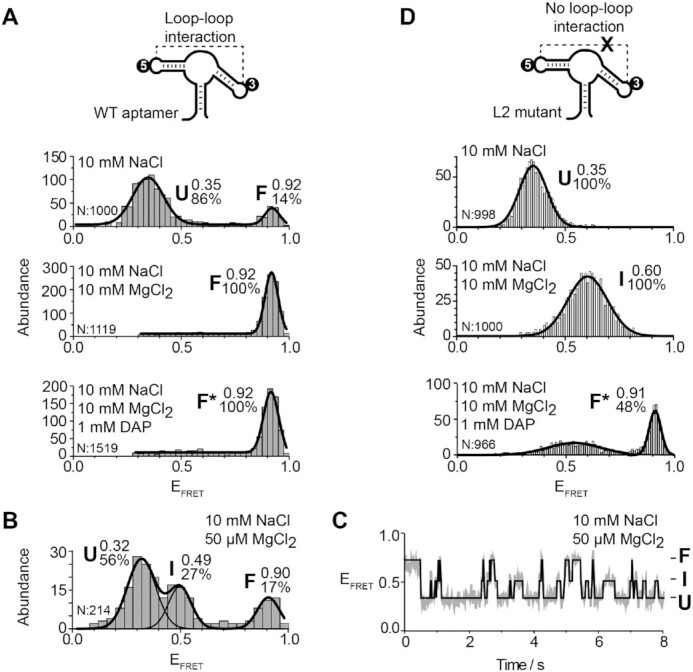
Figure 2.

smFRET analysis for the vector P2–P3 of the adenine aptamer. (A, D) smFRET experiments performed for the wild-type (A) and the L2 mutant (D) aptamers. The cartoon represents the dual-labeled aptamer used in each case. The labeling positions of the donor Cy3 (3) and the acceptor Cy5 (5) are indicated. Population histograms are shown in presence of 10 mM NaCl (top panel), 10 mM NaCl and 10 mM MgCl2 (middle panel) and 10 mM NaCl, 10 mM MgCl2 and 1 mM DAP (lower panel). EFRET values determined by fitting analysis to a Gaussian distribution for each population are indicated. Unfolded (U), intermediate (I), ligand-free folded (F) and ligand-bound folded (F*) are shown. The number of analyzed molecules (N) and the proportion of each analyzed population are indicated. (B, C) smFRET histograms (B) and a time trace (C) for the wild-type aptamer in 10 mM NaCl and 50 μM MgCl2. The corresponding FRET structural states are shown at the right of the time trace. The solid line represents the three-state trajectory obtained from a hidden Markov modeling of the experimental trace.
